C-B3B3 Design basis
PDF page 381 · AISC 360-22
As stated in this Specification: “design shall be such that no applicable strength or serviceability limit state shall be exceeded when the structure is subjected to all applicable load combinations.” A limit state is a condition in which a structural system or component becomes unfit for its intended purpose (serviceability limit state) or has reached its ultimate load-carrying capacity (strength limit state). Limit states may be dictated by functional requirements, such as maximum deflections or drift; they may be related to structural behavior, such as the formation of a plastic hinge or mechanism; or they may represent the collapse of the whole or part of the structure, such as by instability or rupture. The design provisions in this Specification are established so that the probability of exceeding a limit state is acceptably small by stipulating the combination of load factors, resistance or safety factors, nominal loads, and nominal strengths consistent with the design assumptions.
Two kinds of limit states apply to structures: (a) strength limit states, which define safety against local or overall failure conditions during the intended life of the structure; and (b) serviceability limit states, which define functional requirements. This Specification, like other structural design codes, focuses primarily on strength limit states because of overriding considerations of public safety. This does not mean that limit states of serviceability (see Chapter L) are not important to the designer, who must provide for functional performance and economy of design. However, serviceability considerations permit more exercise of judgment on the part of the designer.
Load and resistance factor design (LRFD) and allowable strength design (ASD) are distinct methods for satisfying strength limit states. They are equally acceptable by this Specification, but their provisions are not interchangeable. Indiscriminate use of combinations of the two methods could result in unpredictable performance or unsafe design. Thus, the LRFD and ASD methods are specified as alternatives. There are, however, circumstances in which the two methods could be used in the design, modification, or renovation of a structural system without conflict, such as providing modifications to a structural floor system of an older building after assessing the as-built conditions.
Strength limit states vary from element to element, and several limit states may apply to a given element. The most common strength limit states are yielding, buckling, and rupture. The most common serviceability limit states include deflections or drift, and vibrations.
B3.1 Design for Strength Using Load and Resistance Factor Design (LRFD)
Design for strength by LRFD is performed in accordance with Equation B3-1. The left side of Equation B3-1, , represents the required strength computed by structural analysis based on load combinations stipulated in ASCE/SEI 7, Section 2.3 (or their equivalent) (ASCE, 2022), while the right side, , represents the limiting structural resistance, or design strength, provided by the member or element.
The resistance factor, , in this Specification is equal to or less than 1.00 . When compared to the nominal strength, , computed according to the methods given in Chapters D through K, a of less than 1.00 accounts for approximations in the theory
and variations in mechanical properties and dimensions of members and frames. For limit states where , the nominal strength is judged to be sufficiently conservative when compared to the actual strength that no reduction is needed.
The LRFD provisions are based on (1) probabilistic models of loads and resistance, (2) a calibration of the LRFD provisions to the 1978 edition of the ASD Specification for selected members (AISC, 1978), and (3) the evaluation of the resulting provisions by judgment and past experience aided by comparative design office studies of representative structures.
In the probabilistic basis for LRFD (Ravindra and Galambos, 1978; Ellingwood et al., 1982), the load effects, , and the resistances, , are modeled as statistically independent random variables. In Figure C-B3.1, relative frequency distributions for and are portrayed as separate curves on a common plot for a hypothetical case. As long as the resistance, , is greater than (to the right of) the effects of the loads, , a margin of safety for the particular limit state exists. However, because and are random variables, there is a small probability that may be less than . The probability of this limit state is related to the degree of overlap of the frequency distributions in Figure C-B3.1, which depends on the positioning of their mean values ( versus ) and their dispersions.
The probability that is less than depends on the distributions of the many variables (material, loads, etc.) that determine resistance and total load effect. Often, only the means and the standard deviations or coefficients of variation of the variables involved in the determination of and can be estimated. However, this information is sufficient to build an approximate design provision that is independent of the knowledge of these distributions, by stipulating the following design condition:
(C-B3-1)
where
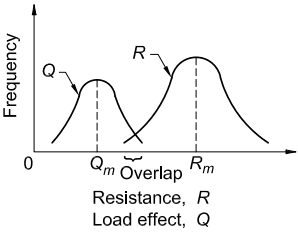
Figure description:
Load-Resistance Overlap
Frequency Distributions of Load effect (Q and Resistance (R
Legend
- Resistance, R — color: black; symbol: Solid curve labeled R
- Load effect, Q — color: black; symbol: Solid curve labeled Q
Annotations
- Q_m (vertical_line - position: x = peak of distribution Q)
- R_m (vertical_line - position: x = peak of distribution R)
- Overlap (shaded_area - position: Intersection region between the right tail of Q and the left tail of R)
| Relative X | Load effect, Q (Frequency) | Resistance, R (Frequency) |
|---|---|---|
| 0.5 | 1.0 | |
| 1.5 | 4.0 | |
| 2.5 () | 5.0 | |
| 3.5 | 4.0 | 1.0 |
| 4.0 | 2.5 | 2.5 |
| 4.5 | 1.0 | 4.0 |
| 5.5 | 6.5 | |
| 6.5 () | 7.5 | |
| 7.5 | 6.5 | |
| 8.5 | 4.0 | |
| 9.5 | 1.0 |
Notes: The chart is a qualitative representation of reliability concepts. The x-axis represents both load effect and resistance values. Failure occurs in the region labeled 'Overlap' where the load effect exceeds the resistance.
Fig. C-B3.1. Frequency distribution of load effect, Q, and resistance, R.
coefficient of variation of the load effect,
coefficient of variation of the resistance,
reliability index
For structural elements and the usual loading, , and the coefficients of variation, and , can be estimated, so a calculation of
(C-B3-2)
will give a comparative measure of reliability of a structure or component. Extensions to the determination of in Equation C-B3-2 to accommodate additional probabilistic information and more complex design situations are described in Ellingwood et al. (1982) and have been used in the development of the recommended load combinations in ASCE/SEI 7.
The original studies that determined the statistical properties (mean values and coefficients of variation) for the basic material properties and for steel beams, columns, composite beams, plate girders, beam-columns, and connection elements that were used to develop the LRFD provisions are presented in a series of eight articles in the September 1978 issue of the Journal of the Structural Division (ASCE, 1978). The corresponding load statistics are given in Galambos et al. (1982). Based on these statistics, the values of inherent in the 1978 Specification for the Design, Fabrication, and Erection of Structural Steel for Buildings (AISC, 1978) were evaluated under different load combinations (live/dead, wind/dead, etc.) and for various tributary areas for typical members (beams, columns, beam-columns, structural components, etc.). As might be expected, there was a considerable variation in the range of -values. For example, compact rolled beams (flexure) and tension members (yielding) had -values that decreased from about 3.1 at to 2.4 at . This decrease is a result of ASD applying the same factor to dead load, which is relatively predictable, and live load, which is more variable. For bolted or welded connections, was in the range of 4 to 5 .
The variation in that was inherent to ASD is reduced substantially in LRFD by specifying several target -values and selecting load and resistance factors to meet these targets. The Committee on Specifications set the point at which LRFD is calibrated to ASD at for braced compact beams in flexure and tension members at yield. The resistance factor, , for these limit states is 0.90 , and the implied is approximately 2.6 for members and 4.0 for connections. The larger -value for connections reflects the complexity in modeling their behavior, effects of workmanship, and the benefit provided by additional strength. Limit states for other members are handled similarly.
The databases on steel strength used in previous editions of the LRFD Specification (AISC, 1986, 1993, 2000b) were based mainly on research conducted prior to 1970. An important study of the material properties of structural shapes (Bartlett et al., 2003) reflected changes in steel production methods and steel materials that had occurred over the 15 years since the original study. This study indicated that the new steel material characteristics did not warrant changes in the -values.
B3.2 Design for Strength Using Allowable Strength Design (ASD)
The ASD method is provided in this Specification as an alternative to LRFD for use by engineers who prefer to deal with ASD load combinations. The term “allowable strength” has been introduced to emphasize that the basic equations of structural mechanics that underlie the provisions are the same for LRFD and ASD.
Traditional ASD is based on the concept that the maximum stress in a component shall not exceed a specified allowable stress under normal service conditions. The load effects are determined on the basis of an elastic analysis of the structure, while the allowable stress is the limiting stress (at yielding, instability, rupture, etc.) divided by a safety factor. The magnitude of the safety factor and the resulting allowable stress depend on the particular governing limit state against which the design must produce a certain margin of safety. For any single element, there may be a number of different allowable stresses that must be checked.
The safety factor in traditional ASD provisions was a function of both the material and the component being considered. It may have been influenced by factors such as member length, member behavior, load source, and anticipated quality of workmanship. The traditional safety factors were based solely on experience and had remained unchanged for over 50 years. Although ASD-designed structures have performed adequately over the years, the actual level of safety provided was never known. This was a principal drawback of the traditional ASD approach. An illustration of typical performance data is provided in Bjorhovde (1978), where theoretical and actual safety factors for columns are examined.
Design for strength by ASD is performed in accordance with Equation B3-2. The ASD method provided in the Specification recognizes that the controlling modes of failure are the same for structures designed by ASD and LRFD. Thus, the nominal strength that forms the foundation of LRFD is the same nominal strength that provides the foundation for ASD. When considering available strength, the only difference between the two methods is the resistance factor in LRFD, , and the safety factor in ASD, .
In developing appropriate values of for use in this Specification, the aim was to result in similar levels of safety and reliability for the two methods. A straightforward approach for relating the resistance factor and the safety factor was developed. The original LRFD Specification (AISC, 1986) was calibrated to the 1978 ASD Specification (AISC, 1978) at a live load-to-dead load ratio of 3. Thus, by equating the designs for the two methods at a live load-to-dead load ratio of 3, the relationship between and can be determined. Using the live plus dead load combinations with yields the following relationships.
For design according to Section B3.1 (LRFD)
(C-B3-3)
For design according to Section B3.2 (ASD)
(C-B3-4)
Equating from the LRFD and ASD formulations and solving for yields
(C-B3-5)
Throughout this Specification, the values of Ω were obtained from the values of φ
Throughout this Specification, the values of Ω were obtained from the values of φ by Equation C-B3-5.
Based on Equation C-B3-5, the relationship between available strengths for LRFD and ASD is seen to be a constant of 1.5. However, that cannot be said for the relationship between required strengths for LRFD and ASD that are based on the load combinations given in ASCE/SEI 7. Thus, the exact level of safety will vary between LRFD and ASD. For the gravity load combinations given in Equations C-B3-3 and C-B3-4, and the assumed , ASD safety is equivalent to that for LRFD according to Equation C-B3-5. An alternative way to present the relationship between LRFD and ASD is to consider the ratio of the LRFD demand-to-capacity ratio to the ASD demand-to-capacity ratio (Salmon et al., 2008). Thus,
(C-B3-6)
Equation C-B3-6 can be understood to provide the LRFD evaluation of an ASD design, with values below unity indicating that ASD is conservative with respect to LRFD and values above unity indicating that ASD is unconservative with respect to LRFD. With the parameters , and , Equation C-B3-6 will provide ratios of DCRs ranging from 0.830 to 1.067 . Values of have a ratio below unity (indicating ASD is conservative compared to LRFD) and values of have a ratio above unity (indicating ASD is unconservative compared to LRFD). The unconservative value of 1.067 is considered acceptable; such a minor difference does not have a significant effect on reliability.
A much larger variation in the ratio of DCRs may be observed for the ASCE/SEI 7 wind and earthquake lateral load combinations. For example, for members in which the ratio of the wind load effect to the dead load effect is high ( ), a situation that may be assumed for the design of several elements in a lateral force-resisting system such as diagonal braces and often the columns that support them, the ratio of the DCRs ranged from 0.90 to as high as 1.36 depending on the significance of second-order effects, which were varied from to 1.5 , and the live load-to-dead load ratio, which was varied from to 5 . The ratio was taken to apply to both the element and, for determination of second-order effects, the structure as a whole. With the exception of , all of the ratios of DCRs exceeded unity, with values exceeding 1.20 for the majority of the range of and considered.
The larger ratios of DCRs, values exceeding 1.2, were observed for values in excess of 1.1 and ratios in excess of 2.0 . It is noted that steel buildings with such values and ratios may not be uncommon. Similar results were obtained for lateral load combinations including earthquake loads, , although the ratio of DCRs tended to be smaller. Designers should thus be aware of the differences in design results between the two methods at these higher ratios of , and , with ASD potentially being less conservative than LRFD and having a lower level of safety and reliability.
One way to bring the safety and reliability of ASD into alignment with that of LRFD when considering lateral load combinations is to supplement the ASD lateral load combinations with LRFD lateral load combinations divided by 1.5. By also using an ASD/LRFD force level adjustment factor of instead of , as prescribed in Section C2, lateral systems designed using ASD will be exactly the same as those designed by LRFD. The resulting ASD designs would then be consistent with LRFD load combinations and would thus achieve the same level of safety and reliability as LRFD designs. A better approach, however, is to completely switch to design by LRFD. This will provide an approach to design with safety and reliability at a consistent level across all conditions.
B3.3 Required Strength
This Specification permits the use of elastic or inelastic, which includes plastic, structural analysis. Generally, design is performed by elastic analysis. Provisions for inelastic and plastic analysis are given in Appendix 1. The required strength is determined by the appropriate methods of structural analysis.
In some circumstances, as in the proportioning of stability bracing members that carry no calculated forces (see, for example, Appendix 6), the required strength is explicitly stated in this Specification.
B3.4 Design of Connections and Supports
This section provides the charging language for Chapter J and Chapter K on the design of connections and supports. Chapter J covers the proportioning of the individual elements of a connection (angles, welds, bolts, etc.) once the load effects on the connection are known. According to the provisions of this section, the modeling assumptions associated with the structural analysis must be consistent with the conditions used in Chapter J to proportion the connecting elements.
In many situations, it is not necessary to include the connection elements as part of the analysis of the structural system. For example, simple and fully restrained (FR) connections may often be idealized as pinned or fixed, respectively, for the purposes of structural analysis. Once the analysis has been completed, the deformations or forces computed at the joints may be used to proportion the connection elements. The classifications of FR and simple connections are meant to justify these idealizations for analysis with the provision that if, for example, one assumes a connection to be FR for the purposes of analysis, the actual connection must meet the FR conditions. In other words, it must have adequate strength and stiffness, as described in the provisions, and discussed in the following.
In certain cases, the deformation of the connection elements affects the way the structure resists load and hence the connections must be included in the analysis of the structural system. These connections are referred to as partially restrained (PR) moment connections. For structures with PR connections, the connection flexibility must be estimated and included in the structural analysis, as described in the following sections. Once the analysis is complete, the load effects and deformations computed for the connection can be used to check the adequacy of the connecting elements.
For simple and FR connections, the connection proportions are established after the final analysis of the structural design is completed, thereby greatly simplifying the design cycle. In contrast, the design of PR connections (like member selection) is inherently iterative because one must assume values of the connection proportions in order to establish the force-deformation characteristics of the connection needed to perform the structural analysis. The life-cycle performance characteristics must also be considered. The adequacy of the assumed proportions of the connection elements can be verified once the outcome of the structural analysis is known. If the connection elements are inadequate, then the values must be revised and the structural analysis repeated. The potential benefits of using PR connections for various types of framing systems are discussed in the literature referenced in the following.
Connection Classification. The basic assumption made in classifying connections is that the most important behavioral characteristics of the connection can be modeled by a moment-rotation, , curve. Figure C-B3.2 shows a typical curve. Implicit in the moment-rotation curve is the definition of the connection as being a region of the column and beam along with the connecting elements. The connection response is defined this way because the rotation of the member in a physical test is generally measured over a length that incorporates the contributions of not only the connecting elements, but also the ends of the members being connected and the column panel zone.
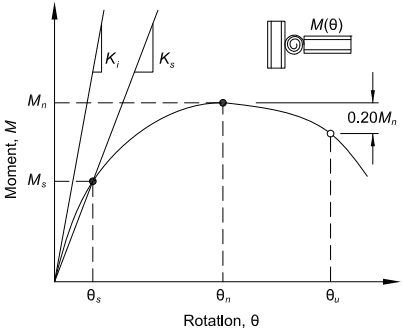
Figure description:
Typical Moment-Rotation (M-θ Curve
Moment-Rotation Relationship
Annotations
- K_i (slope_label - position: Initial tangent slope from origin)
- K_s (slope_label - position: Secant slope through (θ_s, M_s))
- 0.20 * M_n (dimension_line - position: Vertical drop from peak moment M_n to moment at θ_u)
- θ_s (vertical_line - position: x = θ_s)
- θ_n (vertical_line - position: x = θ_n)
- θ_u (vertical_line - position: x = θ_u)
- M_s (horizontal_line - position: y = M_s)
- M_n (horizontal_line - position: y = M_n)
| Point | Rotation (θ) | Moment (M) | Series |
|---|---|---|---|
| Origin | 0 | 0 | Moment-Rotation Curve |
| Service/Yield Point | θ_s | M_s | Moment-Rotation Curve |
| Peak Capacity Point | θ_n | M_n | Moment-Rotation Curve |
| Ultimate Point | θ_u | 0.80 * M_n | Moment-Rotation Curve |
| Origin | 0 | 0 | Initial Stiffness Line (K_i) |
| Tangent End | θ > 0 | K_i * θ | Initial Stiffness Line (K_i) |
| Origin | 0 | 0 | Secant Stiffness Line (K_s) |
| Intersection Point | θ_s | M_s | Secant Stiffness Line (K_s) |
Notes: The diagram displays a typical nonlinear moment-rotation curve for a structural joint. It identifies initial stiffness (K_i, secant stiffness (K_s, peak moment (M_n, and ultimate rotation (θ_u corresponding to a 20% strength degradation from the peak.))))
Fig. C-B3.2. Definition of stiffness, strength, and ductility characteristics of the moment-rotation response of a partially restrained connection.
Examples of connection classification schemes include those in Bjorhovde et al. (1990) and Eurocode 3 (CEN, 2005a). These classifications account directly for the stiffness, strength, and ductility of the connections.
Connection Stiffness. Because the nonlinear behavior of the connection manifests itself even at low moment-rotation levels, the initial stiffness of the connection, , (shown in Figure C-B3.2) does not adequately characterize connection response at service levels. Furthermore, many connection types do not exhibit a reliable initial stiffness, or it exists only for a very small moment-rotation range. The secant stiffness, , at service loads is taken as an index property of connection stiffness. Specifically,
(C-B3-7)
where
moment at service loads, kip-in. (N-mm)
rotation at service loads, rad
In the following discussion, and are the length and bending rigidity, respectively, of the beam.
If , it is acceptable to consider the connection to be fully restrained (in other words, able to maintain the angles between members). If , it is acceptable to consider the connection to be simple (in other words, it rotates without developing moment). Connections with stiffnesses between these two limits are partially restrained and the stiffness, strength, and ductility of the connection must be considered in the design (Leon, 1994). Examples of FR, PR, and simple connection response curves are shown in Figure C-B3.3. The points marked indicate the service load states for the example connections and thereby define the secant stiffnesses for those connections.
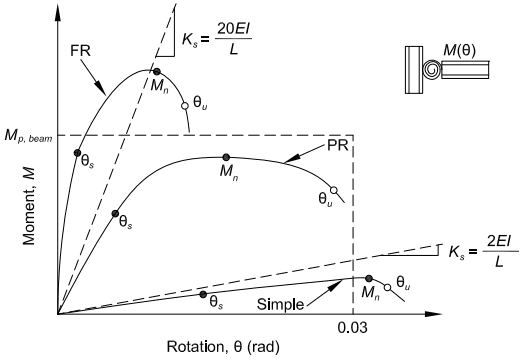
Figure description:
Classification of Moment-Rotation Behavior
Moment-Rotation Behavior of Beam-to-Column Connections
Legend
- FR (Fully Restrained — color: black; symbol: Solid line with solid and open circular markers
- PR (Partially Restrained — color: black; symbol: Solid line with solid and open circular markers
- Simple — color: black; symbol: Solid line with solid and open circular markers
- Stiffness/Classification Boundaries — color: black; symbol: Dashed lines
Annotations
- limit (horizontal_line - position: y = 1.0 on axis)
- 0.03 rad limit (vertical_line - position: x = 0.03)
- (text_label - position: top-left, above steep dashed line)
- (text_label - position: bottom-right, above shallow dashed line)
- Connection Schematic (image_inset - position: top-right quadrant)
| Series | Point Type | Rotation, (rad) | Moment, |
|---|---|---|---|
| FR (Fully Restrained) | Origin | 0.000 | 0.00 |
| FR (Fully Restrained) | Service Rotation, | 0.003 | 0.75 |
| FR (Fully Restrained) | Nominal Moment, | 0.012 | 1.30 |
| FR (Fully Restrained) | Ultimate Rotation, | 0.015 | 1.10 |
| PR (Partially Restrained) | Origin | 0.000 | 0.00 |
| PR (Partially Restrained) | Service Rotation, | 0.008 | 0.50 |
| PR (Partially Restrained) | Nominal Moment, | 0.020 | 0.90 |
| PR (Partially Restrained) | Ultimate Rotation, | 0.029 | 0.70 |
| Simple | Origin | 0.000 | 0.00 |
| Simple | Service Rotation, | 0.018 | 0.12 |
| Simple | Nominal Moment, | 0.032 | 0.16 |
| Simple | Ultimate Rotation, | 0.036 | 0.14 |
| Stiffness Boundary | Point 1 | 0.000 | 0.00 |
| Stiffness Boundary | Point 2 | 0.005 | 1.00 |
| Stiffness Boundary | Point 1 | 0.000 | 0.00 |
| Stiffness Boundary | Point 2 | 0.030 | 0.20 |
Notes: The chart displays the non-linear relationship between Moment () and Rotation () for three connection types. Key markers include (service rotation, (peak nominal moment, and (ultimate rotation. The dashed box formed by and represents standard performance benchmarks.)))
Fig. C-B3.3. Classification of moment-rotation response of fully restrained (FR), partially restrained (PR), and simple connections.
Connection Strength. The strength of a connection is the maximum moment that it is capable of carrying, , as shown in Figure C-B3.2. The strength of a connection can be determined on the basis of an ultimate limit-state model of the connection, or from physical tests. If the moment-rotation response does not exhibit a peak load then the strength can be taken as the moment at a rotation of 0.02 rad (Hsieh and Deierlein, 1991; Leon et al., 1996).
It is also useful to define a lower limit on strength below which the connection may be treated as a simple connection. Connections that transmit less than 20% of the fully plastic moment of the beam at a rotation of 0.02 rad may be considered to have no flexural strength for design. However, it should be recognized that the aggregate strength of many weak connections can be important when compared to that of a few strong connections (FEMA, 1997).
In Figure C-B3.3, the points marked indicate the maximum strength states of the example connections. The points marked indicate the maximum rotation states of the example connections. Note that it is possible for an FR connection to have a strength less than the strength of the beam. It is also possible for a PR connection to have a strength greater than the strength of the beam. The strength of the connection must be adequate to resist the moment demands implied by the design loads.
Connection Ductility. If the connection strength substantially exceeds the fully plastic moment strength of the beam, then the ductility of the structural system is controlled by the beam and the connection can be considered elastic. If the connection strength only marginally exceeds the fully plastic moment strength of the beam, then the connection may experience substantial inelastic deformation before the beam reaches its full strength. If the beam strength exceeds the connection strength, then deformations can concentrate in the connection. The ductility required of a connection will depend upon the particular application. For example, the ductility requirement for a braced frame in a nonseismic area will generally be less than the ductility required in a high seismic area. The rotation ductility requirements for seismic design depend upon the structural system (AISC, 2022c).
In Figure C-B3.2, the rotation capacity, , can be defined as the value of the connection rotation at the point where either (a) the resisting strength of the connection has dropped to or (b) the connection has deformed beyond 0.03 rad. This second criterion is intended to apply to connections where there is no loss in strength until very large rotations occur. It is not prudent to rely on these large rotations in design.
The available rotation capacity, , should be compared with the rotation required at the strength limit state, as determined by an analysis that takes into account the nonlinear behavior of the connection. (Note that for design by ASD, the rotation required at the strength limit state should be assessed using analyses conducted at 1.6 times the ASD load combinations.) In the absence of an accurate analysis, a rotation capacity of 0.03 rad is considered adequate. This rotation is equal to the minimum beam-to-column connection capacity as specified in the seismic provisions for special moment frames (AISC, 2022c). Many types of PR connections, such as top- and seat-angle connections, meet this criterion.
Structural Analysis and Design. When a connection is classified as PR, the relevant response characteristics of the connection must be included in the analysis of the structure to determine the member and connection forces, displacements, and the frame stability. Therefore, PR construction requires, first, that the moment-rotation characteristics of the connection be known and, second, that these characteristics be incorporated in the analysis and member design.
Typical moment-rotation curves for many PR connections are available from one of several databases (Goverdhan, 1983; Ang and Morris, 1984; Nethercot, 1985; Kishi and Chen, 1986). Care should be exercised when utilizing tabulated moment-rotation curves not to extrapolate to sizes or conditions beyond those used to develop the database because other failure modes may control (ASCE, 1997). When the connections to be modeled do not fall within the range of the databases, it may be possible to determine the response characteristics from tests, simple component modeling, or finite element studies (FEMA, 1995). Examples of procedures to model connection behavior are given in the literature (Bjorhovde et al., 1988; Chen and Lui, 1991; Bjorhovde et al., 1992; Lorenz et al., 1993; Chen and Toma, 1994; Chen et al., 1995; Bjorhovde et al., 1996; Leon et al., 1996; Leon and Easterling, 2002; Bijlaard et al., 2005; Bjorhovde et al., 2008).
The degree of sophistication of the analysis depends on the problem at hand. Design for PR construction usually requires separate analyses for the serviceability and strength limit states. For serviceability, an analysis using linear springs with a stiffness given by (see Figure C-B3.2) is sufficient if the resistance demanded of the connection is well below the strength. When subjected to strength load combinations, a procedure is needed whereby the characteristics assumed in the analysis are consistent with those of the connection response. The response is especially nonlinear as the applied moment approaches the connection strength. In particular, the effect of the connection nonlinearity on second-order moments and other stability checks needs to be considered (ASCE, 1997). The use of the direct analysis method with PR connections has been demonstrated (Surovek et al., 2005; White and Goverdhan, 2008).
B3.5 Design of Diaphragms and Collectors
This section provides charging language for the design of structural steel components (members and their connections) of diaphragms and collector systems.
Diaphragms transfer in-plane lateral loads to the lateral force-resisting system. Typical diaphragm elements in a building structure are the floor and roof systems, which accumulate lateral forces due to gravity, wind, and/or seismic loads, and distribute these forces to individual elements (braced frames, moment frames, shear walls, etc.) of the vertically oriented lateral force-resisting system of the building structure. Collectors (also known as drag struts) are often used to collect and deliver diaphragm forces to the lateral force-resisting system.
Diaphragms are classified into one of three categories: rigid, semi-rigid, or flexible. Rigid diaphragms distribute the in-plane forces to the lateral force-resisting system with negligible in-plane deformation of the diaphragm. A rigid diaphragm may be assumed to distribute the lateral loads in proportion to the relative stiffness of the
individual elements of the lateral force-resisting system. A semi-rigid diaphragm distributes the lateral loads in proportion to the in-plane stiffness of the diaphragm and the relative stiffness of the individual elements of the lateral force-resisting system. With a flexible diaphragm, the in-plane stiffness of the diaphragm is negligible compared to the stiffness of the lateral force-resisting system and, therefore, the distribution of lateral forces is independent of the relative stiffness of the individual elements of the lateral force-resisting system. In this case, the distribution of lateral forces may be computed in a manner analogous to a series of simple beams spanning between the lateral force-resisting system elements.
Diaphragms should be designed for the shear, moment, and axial forces resulting from the design loads. The diaphragm response may be considered analogous to a deep beam where the flanges (often referred to as chords of the diaphragm) develop tension and compression forces, and the web resists the shear. The component elements of the diaphragm need to have strength and deformation capacity consistent with the assumptions and intended behavior.
B3.6 Design of Anchorages to Concrete
This section provides the charging language for Chapter I and Chapter J on design of anchorages to concrete.
B3.7 Design for Stability
This section provides the charging language for Chapter C on design for stability.
B3.8 Design for Serviceability
This section provides the charging language for Chapter L on design for serviceability.
B3.9 Design for Structural Integrity
This section provides the minimum connection design criteria for satisfying structural integrity requirements where required by the applicable building code. Section 1616 of the International Building Code (ICC, 2021) assigns structural integrity requirements to high-rise buildings in risk category III or IV, which means that the number of buildings to which this requirement currently applies is limited.
Evaluation of built structures that have been subjected to extraordinary events indicates that structures that have a higher level of connectivity perform better than those that do not. The intent of the integrity requirements is to achieve this improved connectivity by limiting the possibility of a connection failure when it is subjected to unanticipated tension forces. The forces can result from a wide range of events such as cool-down after a fire, failure of adjacent structural members, and blast or impact loads on columns. The Specification integrity checks are similar in principle to those defined in other model codes and international codes that have provided good historical performance (Geschwindner and Gustafson, 2010). The fundamental aspect of the integrity requirement is that it is a connection design requirement only and is not a design force applied to any part of the structure other than the connection itself. In addition, the forces determined for the integrity check are not to be combined with any other forces and the integrity connection design check is to be conducted
separately. The structural integrity requirements are a detailing requirement for the connection and not a load or force applied to the structure.
Section B3.9(a) provides the nominal tensile strength for column splices. The intent of this requirement is to provide a minimum splice capacity for the resistance of unanticipated forces. This requirement is based on the assumption that two floors are supported by the splice. Any live load reduction should be the same as that used for the design of the connections of the floor members framing to the column. The tension design force should be distributed reasonably uniformly between the flanges and web so that some bending and shear capacity is provided in addition to the tension capacity. A load path for this tension force does not need to be provided.
Section B3.9(b) provides the minimum nominal axial tensile strength of the end connection of beams that frame to girders and also for beams or girders that frame to columns. Geschwindner and Gustafson (2010) have shown that single-plate connections designed to resist shear according to this Specification will satisfy this requirement. Because inelastic deformation is permitted for the integrity check, it is expected that most other framed connections, such as double-angle connections, can be shown to satisfy this requirement through nonlinear analysis or yield line analysis. The forces determined in this section are to be applied to only the connection design itself and are not to be included in the member design. In particular, checking the local bending of column and beam webs induced by the tension is not required by this section.
Section B3.9(c) provides the minimum nominal tensile force to brace columns. Maintaining column bracing is one of the fundamental principles for providing structural integrity. Because column bracing elements are usually much lighter than the column, extraordinary events have more potential to affect the bracing member or the slab surrounding the column than the column itself. This is the reason that the steel connection itself is required to provide the bracing force. The assumption is that the extraordinary event has compromised the ability of the column to be braced by the slab or by one of the beams framing to the column. This tensile bracing force requirement is to be applied separately from other bracing requirements, as specified in Appendix 6. Note that the requirements of this section will usually govern for the lower stories of high-rise buildings, whereas Section B3.9(a) will govern in most other situations.
Although the integrity requirements need be applied only when required by code, they should be considered for any building where improved structural performance under undefined extraordinary events is desired. For structures that have a defined extraordinary load, reference should be made to ASCE/SEI 7 (ASCE, 2022). For structures that are required to be designed to resist progressive (disproportionate) collapse, reference should be made to the ASCE/SEI 7 Commentary.
B3.10 Design for Ponding
As used in this Specification, ponding refers to the retention of water due solely to the deflection of roof framing under all loads (including dead loads) present at the onset of ponding and the subsequent accumulation of rainwater and snowmelt. The amount of accumulated water is dependent on the stiffness of the roof’s structural framing system. Unbounded incremental deflections due to the incremental increase
in retained water can result in the collapse of the roof. The problem becomes catastrophic when more water causes more deflection, resulting in a greater opportunity for more water to accumulate until the roof collapses.
The Specification requires that design for ponding be considered if water is impounded on the roof, irrespective of roof slope. Camber and deflections due to loads acting concurrently with rain loads must be considered in establishing the initial conditions.
Determination of ponding stability is typically done by structural analysis where the rain loads are increased by the incremental deflections of the structural framing system to the accumulated rainwater, assuming the primary roof drains are blocked.
Previous editions of this Specification detailed provisions and design aids for determining ponding stability and strength in Appendix 2. These methods were applicable to a limited class of roof configurations and were inconsistent with the remainder of the Specification. For these reasons, they have been removed, and methods and discussions for analyzing and designing for ponding stability may be found in SJI Technical Digest 3, Structural Design of Steel Joist Roofs to Resist Ponding Loads (Fisher and Denavit, 2018).
B3.11 Design for Fatigue
Fatigue is a limit state that must be considered like other limit states but only in specific applications. There are situations where fatigue may be a controlling limit state, such as in crane runways and their supports. Experience has shown that the cyclic loading associated with the effects of wind or snow loading on typical building systems does not cause fatigue because the number of high stress-range cycles is typically low enough to preclude fatigue crack initiation.
Appendix 3 deals with high cycle, low stress-range fatigue; while seismic loading is also cyclic, it involves low cycle, high stress-range fatigue, which is not considered in Appendix 3. The effects of low cycle fatigue are implicitly considered in the requirements of the AISC Seismic Provisions for Structural Steel Buildings (AISC, 2022c), and the AISC Prequalified Connections for Special and Intermediate Steel Moment Frames for Seismic Applications (AISC, 2022b).
B3.12 Design for Fire Conditions
This section provides the charging language for Appendix 4 on structural design for fire resistance. Both alternatives, (a) qualification testing and (b) analysis, are deemed acceptable for providing fire resistance. Design by analysis is addressed in Appendix 4, Sections 4.1 and 4.2. Qualification testing is addressed in Appendix 4, Section 4.3, which includes relevant provisions reproduced from the International Building Code (ICC, 2018), ASCE/SEI/SFPE Standard 29 (ASCE, 2005), ASTM E119 (ASTM, 2020d), and similar documents.
B3.13 Design for Corrosion Effects
Steel members may deteriorate in some service environments. This deterioration may appear either as external corrosion, which would be visible upon inspection,
or in undetected changes that would reduce member strength. The designer should recognize these problems by either factoring a specific amount of tolerance for damage into the design or providing adequate protection (for example, coatings or cathodic protection) and/or planned maintenance programs so that such problems do not occur.
Because the interior of a hollow structural section (HSS) is difficult to inspect, some concern has been expressed regarding internal corrosion. However, good design practice can eliminate the concern and the need for expensive protection. Corrosion occurs in the presence of oxygen and water. In an enclosed building, it is improbable that there would be sufficient reintroduction of moisture to cause severe corrosion. Therefore, internal corrosion protection is a consideration only in HSS exposed to weather.
In a sealed HSS, internal corrosion cannot progress beyond the point where the oxygen or moisture necessary for chemical oxidation is consumed (AISI, 1970). The oxidation depth is insignificant when the corrosion process must stop, even when a corrosive atmosphere exists at the time of sealing. If fine openings exist at connections, moisture and air can enter the HSS through capillary action or by aspiration due to the partial vacuum that is created if the HSS is cooled rapidly (Blodgett, 1967). This can be prevented by providing pressure-equalizing holes in locations that make it impossible for water to flow into the HSS by gravity.
Situations where conservative practice would recommend an internal protective coating include (a) open HSS where changes in the air volume by ventilation or direct flow of water is possible, and (b) open HSS subjected to a temperature gradient that would cause condensation.
HSS that are filled or partially filled with concrete should not be sealed. In the event of fire, water in the concrete will vaporize and may create pressure sufficient to burst a sealed HSS. Care should be taken to keep water from remaining in the HSS during or after construction, because the expansion caused by freezing can create pressure that is sufficient to burst an HSS.
Galvanized HSS assemblies should not be completely sealed because rapid pressure changes during the galvanizing process tend to burst sealed assemblies.