C-3.33.3 plain material and welded joints
PDF page 658 · AISC 360-22
Fatigue resistance has been derived from an exponential relationship between the number of cycles to failure, , and the stress range, , called an relationship, of the form
(C-A-3-1)
The general relationship is often plotted as a linear log-log function (log ). Figure C-A-3.1 shows the family of fatigue resistance curves identified as stress categories A, B, B', C, D, E, E', and G. These relationships were established based on an extensive database developed in the United States and abroad (Keating and Fisher, 1986). The allowable stress range has been developed by adjusting the coefficient, , so that a design curve is provided that lies two standard deviations of the standard error of estimate of the fatigue cycle life below the mean relationship of the actual test data. These values of correspond to a probability of failure of of the design life.
The number of stress range fluctuations in a design life, , in Equation A-3-1, can often be calculated as
(C-A-3-2)
Stress category F is shown in Figure C-A-3.2 and has a slope different than the other stress categories. The fatigue resistance of stress category C′ or C′′ details is determined by applying a reduction factor, RPJP or RFIL, respectively, to the stress category C stress range, which shifts the fatigue resistance curve for stress category C downward by a factor proportional to the reduction. Unlike stress category C, stress category C′ and C′′ details do not have a fatigue threshold.
Prior to the 1999 AISC Load and Resistance Factor Design Specification for Structural Steel Buildings (AISC, 2000b), stepwise tables meeting the criteria discussed in the foregoing, including cycles of loading, stress categories, and allowable stress ranges were provided in the Specification. A single table format (Table A-3.1) was
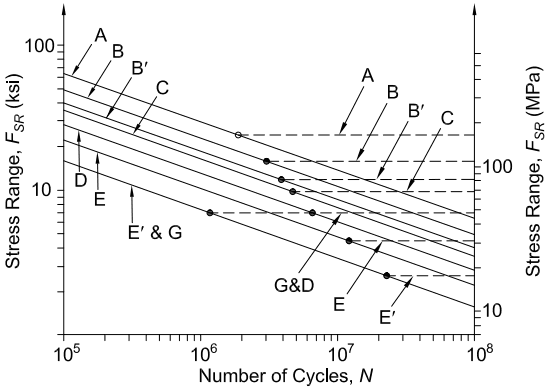
Figure description:
AASHTO Fatigue Resistance Curves Stress Range, F_SR vs. Number of Cycles, N
Fatigue Design Curves (S-N Curves
Legend
- A — color: black; symbol: solid line
- B — color: black; symbol: solid line
- B' — color: black; symbol: solid line
- C — color: black; symbol: solid line
- D — color: black; symbol: solid line
- E — color: black; symbol: solid line
- E' & G — color: black; symbol: solid line
- Constant-Amplitude Fatigue Limits (CAFL — color: black; symbol: dashed horizontal lines
Annotations
- Knee for Category A (CAFL = 24 ksi (text_label - position: N ≈ 1.8E+06, F_SR = 24))
- Knee for Category B (CAFL = 16 ksi (text_label - position: N ≈ 3.0E+06, F_SR = 16))
- Knee for Category B' (CAFL = 12 ksi (text_label - position: N ≈ 3.5E+06, F_SR = 12))
- Knee for Category C (CAFL = 10 ksi (text_label - position: N ≈ 4.4E+06, F_SR = 10))
- Knee for Categories D & G (CAFL = 7 ksi (text_label - position: N ≈ 6.4E+06 (D, N ≈ 1.1E+06 (G, F_SR = 7))))
- Knee for Category E (CAFL = 4.5 ksi (text_label - position: N ≈ 1.2E+07, F_SR = 4.5))
- Knee for Category E' (CAFL = 2.6 ksi (text_label - position: N ≈ 2.2E+07, F_SR = 2.6))
| Number of Cycles, N | Category A (ksi) | Category B (ksi) | Category B' (ksi) | Category C (ksi) | Category D (ksi) | Category E (ksi) | Category E' (ksi) | Category G (ksi) |
|---|---|---|---|---|---|---|---|---|
| 1.0E+05 | 65.1 | 49.7 | 39.2 | 35.3 | 28.0 | 22.2 | 15.7 | 15.7 |
| 5.0E+05 | 38.1 | 29.1 | 22.9 | 20.6 | 16.4 | 13.0 | 9.2 | 9.2 |
| 1.0E+06 | 30.2 | 23.1 | 18.2 | 16.4 | 13.0 | 10.3 | 7.3 | 7.3 |
| 1.1E+06 | 29.3 | 22.4 | 17.6 | 15.9 | 12.6 | 10.0 | 7.0 | 7.0 |
| 1.8E+06 | 24.0 | 18.9 | 14.9 | 13.4 | 10.6 | 8.5 | 6.0 | 7.0 |
| 3.0E+06 | 24.0 | 16.0 | 12.6 | 11.3 | 9.0 | 7.2 | 5.1 | 7.0 |
| 3.5E+06 | 24.0 | 16.0 | 12.0 | 10.8 | 8.5 | 6.8 | 4.8 | 7.0 |
| 4.4E+06 | 24.0 | 16.0 | 12.0 | 10.0 | 7.9 | 6.3 | 4.4 | 7.0 |
| 6.4E+06 | 24.0 | 16.0 | 12.0 | 10.0 | 7.0 | 5.6 | 3.9 | 7.0 |
| 1.2E+07 | 24.0 | 16.0 | 12.0 | 10.0 | 7.0 | 4.5 | 3.2 | 7.0 |
| 2.2E+07 | 24.0 | 16.0 | 12.0 | 10.0 | 7.0 | 4.5 | 2.6 | 7.0 |
| 5.0E+07 | 24.0 | 16.0 | 12.0 | 10.0 | 7.0 | 4.5 | 2.6 | 7.0 |
| 1.0E+08 | 24.0 | 16.0 | 12.0 | 10.0 | 7.0 | 4.5 | 2.6 | 7.0 |
Notes: The graph depicts AASHTO fatigue resistance curves where the stress range (F_SR is plotted against the number of cycles (N. Sloped portions follow a power-law relationship (S^3*N = A until the Constant-Amplitude Fatigue Limit (CAFL is reached, at which point the curves become horizontal. The dual Y-axes represent stress range in ksi (left and MPa (right.))))))
Fig. C-A-3.1. Fatigue resistance curves.
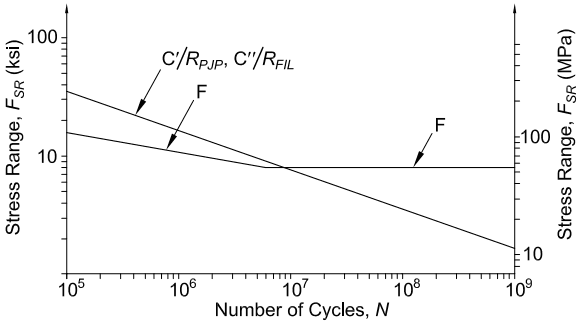
Figure description:
Fatigue Life Chart: Stress Range vs. Number of Cycles
Legend
- C'/R_PJP, C''/R_FIL — color: black; symbol: Solid line
- F — color: black; symbol: Solid line (bilinear
| Number of Cycles, N | Stress Range F_SR (ksi [C'/R_PJP, C''/R_FIL) | Stress Range F_SR (ksi [F) |
|---|---|---|
| 1.0E+05 | 35.0 | 16.0 |
| 1.0E+06 | 16.2 | 11.2 |
| 5.0E+06 | 9.4 | 8.0 |
| 1.0E+07 | 7.5 | 8.0 |
| 1.0E+08 | 3.5 | 8.0 |
| 1.0E+09 | 1.6 | 8.0 |
Notes: The chart represents fatigue stress range (F_SR versus the number of cycles (N on a log-log scale. The Y-axis is presented in both ksi (left and MPa (right. The curve for 'F' transitions to a constant fatigue limit at approximately 8 ksi starting around 5.0E+06 to 7.0E+06 cycles.))))
Fig. C-A-3.2. Fatigue resistance curves for stress categories C and F.
introduced in the 1999 AISC LRFD Specification that provides the stress categories, ingredients for the applicable equation, and information and examples, including the sites of concern for potential crack initiation (AISC, 2000b).
Table A-3.1 is organized into eight sections of general conditions for fatigue design, as follows:
- (1) Section 1 provides information and examples for the steel material at copes, holes, cutouts, or as produced.
- (2) Section 2 provides information and examples for various types of mechanically fastened joints, including eyebars and pin plates.
- (3) Section 3 provides information related to welded connections used to join built-up members, such as longitudinal welds, access holes, and reinforcements.
- (4) Section 4 deals only with longitudinal load-carrying fillet welds at shear splices.
- (5) Section 5 provides information for various types of groove- and fillet-welded joints that are transverse to the applied cyclic stress.
- (6) Section 6 provides information on a variety of groove-welded attachments to flange tips and web plates, as well as similar attachments, connected with either fillet or partial-joint-penetration groove welds.
- (7) Section 7 provides information on several short attachments to structural members.
- (8) Section 8 collects several miscellaneous details, such as shear connectors, shear on the throat of fillet, plug, and slot welds, and their impact on base metal. It also provides for tension on the stress area of various bolts, threaded anchor rods, and hangers.
A similar format and consistent criteria are used by other specifications.
When fabrication details involving more than one stress category occur at the same location in a member, the stress range at that location must be limited to that of the most restrictive category. The need for a member larger than required by static loading will often be eliminated by locating notch-producing fabrication details in regions subjected to smaller ranges of stress.
A detail not explicitly covered before 1989 (AISC, 1989) was added in the 1999 AISC LRFD Specification (AISC, 2000b) to cover tension-loaded plate elements connected at their end by transverse partial-joint-penetration groove or fillet welds in which there is more than a single site for the initiation of fatigue cracking, one of which will be more critical than the others depending upon welded joint type and size, and material thickness (Frank and Fisher, 1979). Regardless of the site within the joint at which potential crack initiation is considered, the allowable stress range provided is applicable to connected material at the toe of the weld.