C-C3C3 Calculation of available strengths
PDF page 411 · AISC 360-22
Section C3 provides that when the analysis meets the requirements in Section C2, the member provisions for available strength in Chapters D through I and connection provisions in Chapters J and K complete the process of design by the direct analysis method. The effective length for flexural buckling may be taken as the unbraced length for all members in the strength checks.
Where beams and columns rely upon braces that are not part of the lateral force-resisting system to define their unbraced length, the braces themselves must have sufficient strength and stiffness to control member movement at the brace points (see Appendix 6). Design requirements for braces that are part of the lateral force-resisting system (that is, braces that are included within the analysis of the structure) are included within Chapter C.
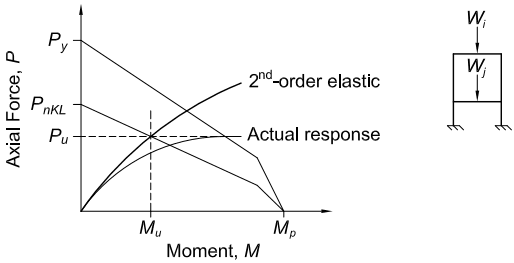
Figure description:
Axial Force vs. Moment Diagram Comparison of second-order elastic response with interaction envelopes
Interaction of Axial Force (P and Moment (M
Annotations
- P_y (text_label - position: y-axis intercept of the uppermost interaction line)
- P_nKL (text_label - position: y-axis intercept of the middle interaction line)
- P_u (text_label - position: y-coordinate of the intersection point)
- M_u (text_label - position: x-coordinate of the intersection point)
- M_p (text_label - position: x-axis intercept of the interaction and response curves)
- (M_u, P_u intersection (text_label - position: Intersection of 2nd-order elastic curve and the P_nKL interaction line))
| Moment, M | 2nd-order elastic | Actual response | Interaction (P_nKL to M_p) | Plastic Limit (P_y to M_p) |
|---|---|---|---|---|
| 0 | 0 | 0 | P_nKL | P_y |
| M_u | P_u | P_u | ||
| M_p | 0 | 0 | 0 |
Notes: The chart illustrates structural response curves for a frame (shown in the inset diagram with loads Wi and Wj. It shows the intersection of a second-order elastic analysis curve with a stability interaction line (from P_nKL to M_p at point (M_u, P_u. The actual response curve and the full plastic capacity envelope (from P_y to M_p are also shown.))))
(a) Effective length method (PnKL is the nominal compressive strength used in the effective length method; see Appendix 7)
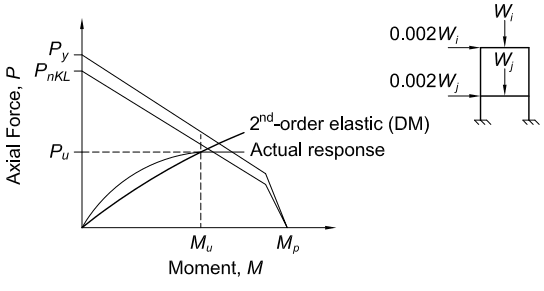
Figure description:
P-M Interaction and Structural Response Analysis of Direct Analysis Method (DM vs. Actual Response
Axial Force (P vs. Moment (M Interaction Diagram
Legend
- 2nd-order elastic (DM — color: black; symbol: straight solid line
- Actual response — color: black; symbol: curved solid line
Annotations
- Pu (horizontal_line - position: y = Pu)
- Mu (vertical_line - position: x = Mu)
- Py (text_label - position: y-axis intercept)
- PnKL (text_label - position: y-axis intercept)
- Mp (text_label - position: x-axis intercept)
- Notional load frame diagram (graphic_overlay - position: top-right corner)
| Series / Curve | Point Description | Moment (M) | Axial Force (P) |
|---|---|---|---|
| Plastic Strength Limit (Upper) | Y-intercept | 0 | Py |
| Plastic Strength Limit (Upper) | Corner point | ~0.85 * Mp | ~0.2 * Py |
| Plastic Strength Limit (Upper) | X-intercept | Mp | 0 |
| Design Strength Limit (Lower) | Y-intercept | 0 | PnKL |
| Design Strength Limit (Lower) | Intersection Point | Mu | Pu |
| Design Strength Limit (Lower) | Corner point | ~0.85 * Mp | ~0.15 * PnKL |
| Design Strength Limit (Lower) | X-intercept | Mp | 0 |
| 2nd-order elastic (DM) | Origin | 0 | 0 |
| 2nd-order elastic (DM) | Intersection Point | Mu | Pu |
| Actual response | Origin | 0 | 0 |
| Actual response | Intersection Point | Mu | Pu |
Notes: The figure displays interaction limits (Plastic and Design for structural members. Two response paths (2nd-order elastic DM and actual response are shown initiating from the origin and intersecting the Design Strength Limit at (Mu, Pu. A secondary diagram shows a two-story frame with vertical loads (Wi, Wj and lateral notional loads (0.002Wi, 0.002Wj.)))))
(b) Direct analysis method (DM)
Fig. C-C2.5. Comparison of in-plane beam-column interaction checks for (a) the effective length method and (b) the direct analysis method (DM).
For beam-columns in single-axis flexure and compression, the analysis results from the direct analysis method may be used directly with the interaction equations in Section H1.3, which address in-plane flexural buckling and out-of-plane lateral-torsional instability separately. These separated interaction equations reduce the conservatism of the Section H1.1 provisions, which combine the two limit state checks into one equation that uses the most severe combination of in-plane and out-of-plane limits for and . A significant advantage of the direct analysis method is that the in-plane check with in the interaction equation is determined using the unbraced length of the member as its effective length.