C-H1H1 Doubly and singly symmetric members subjected to flexure and axial force
PDF page 472 · AISC 360-22
This section contains design provisions for doubly symmetric and singly symmetric members under combined flexure and compression, and under combined flexure and tension. The provisions of this section apply typically to rolled wide-flange shapes, channels, tees, round, square, and rectangular HSS, solid rounds, squares, rectangles, or diamonds, and any of the many possible combinations of doubly or singly symmetric shapes fabricated from plates and/or shapes by welding or bolting. The interaction equations accommodate flexure about one or both principal axes as well as axial compression or tension. The restriction on the ratio that had been included in Section H1.1 of Specifications prior to 2016 was found to be unnecessary and was removed in that edition.
H1.1 Doubly and Singly Symmetric Members Subjected to Flexure and Compression
In 1923, the first AISC Specification (AISC, 1923) required that the stresses due to flexure and compression be added and that the sum not exceed the allowable value. An interaction equation appeared first in the 1936 AISC Specification (AISC, 1936), stating “Members subject to both axial and bending stresses shall be so proportioned that the quantity shall not exceed unity,” in which and are, respectively, the axial and flexural allowable stresses permitted by this Specification, and and are the corresponding stresses due to the axial force and the bending
moment, respectively. This linear interaction equation was in force until the 1961 AISC Specification (AISC, 1961), when it was modified to account for frame stability and for the effect, that is, the secondary bending between the ends of the members (Equation C-H1-1). The effect, that is, the second-order bending moment due to story sway, was not accommodated.
(C-H1-1)
The allowable axial stress, , was usually determined for an effective length that is larger than the actual member length for moment frames. The term is the amplification of the interspan moment due to member deflection multiplied by the axial force (the effect). accounts for the effect of the moment gradient. This interaction equation was part of all the subsequent editions of the AISC ASD Specifications from 1961 through 1989.
A new approach to the interaction of flexural and axial forces was introduced in the 1986 AISC Load and Resistance Factor Design Specification for Structural Steel Buildings (AISC, 1986). The following is an explanation of the thinking behind the interaction curves used. The equations,
(C-H1-2a)
(C-H1-2b)
define the lower-bound curve for the interaction of the nondimensional axial strength, , and flexural strength, , for compact wide-flange stub-columns bent about their -axis. The cross section is assumed to be fully yielded in tension and compression. The symbol is the plastic moment strength of the cross section in the presence of an axial force, . The curve representing Equations C-H1-2 almost overlaps the analytically exact curve for the major-axis bending of a (W200x46.1) cross section (see Figure C-H1.1). The major-axis bending equations for the exact yield capacity of a wide-flange shape (ASCE, 1971) are as follows:
For (for the plastic neutral axis in the web)
(C-H1-3a)
For (for the plastic neutral axis in the flange)
(C-H1-3b)
For major-axis bending, an equation approximating the average yield strength of wide-flange shapes when is given as
(C-H1-4)
When may be taken as .
The curves in Figure C-H1.2 show the exact and approximate yield interaction curves for wide-flange shapes bent about the y-axis, and the exact curves for the solid rectangular and round shapes. It is evident that the lower-bound AISc interaction curves are very conservative for these shapes.
The idea of portraying the strength of stub beam-columns was extended to actual beamcolumns with actual lengths by normalizing the required flexural strength, , of the beam by the nominal strength of a beam without axial force, , and the required axial strength, , by the nominal strength of a column without bending moment, . This rearrangement results in a translation and rotation of the original stub-column interaction curve, as seen in Figure C-H1.3.
The normalized equations corresponding to the beam-column with length effects included are shown as Equation C-H1-5:
(C-H1-5a)
(C-H1-5b)
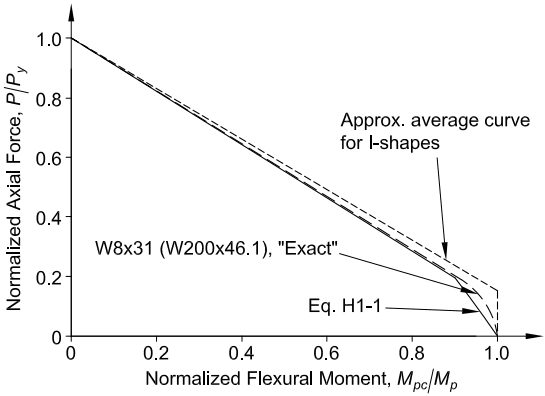
Figure description:
Interaction Curves for Steel I-Shapes
Interaction of Normalized Axial Force and Normalized Flexural Moment
Legend
- Approx. average curve for I-shapes — color: black; symbol: Dashed line
- W8x31 (W200x46.1, "Exact" — color: black; symbol: Solid line
- Eq. H1-1 — color: black; symbol: Solid line (piecewise linear
Annotations
- Approx. average curve for I-shapes (text_label - position: Arrow points to dashed line at (0.86, 0.34))
- W8x31 (W200x46.1, "Exact" (text_label - position: Arrow points to solid line at (0.97, 0.12)))
- Eq. H1-1 (text_label - position: Arrow points to bottom-most solid line at (0.96, 0.05))
| Normalized Flexural Moment, | Normalized Axial Force, (Eq. H1-1) | Normalized Axial Force, (W8x31 "Exact") | Normalized Axial Force, (Approx. average curve for I-shapes) |
|---|---|---|---|
| 0.0 | 1.00 | 1.00 | 1.00 |
| 0.1 | 0.91 | 0.92 | 0.93 |
| 0.2 | 0.82 | 0.83 | 0.86 |
| 0.3 | 0.73 | 0.75 | 0.79 |
| 0.4 | 0.64 | 0.67 | 0.71 |
| 0.5 | 0.56 | 0.59 | 0.64 |
| 0.6 | 0.47 | 0.51 | 0.57 |
| 0.7 | 0.38 | 0.43 | 0.50 |
| 0.8 | 0.29 | 0.34 | 0.42 |
| 0.9 | 0.20 | 0.24 | 0.33 |
| 0.95 | 0.10 | 0.13 | 0.26 |
| 1.0 | 0.00 | 0.00 | 0.15 |
Notes: The chart illustrates normalized interaction curves for axial force (P/Py and flexural moment (Mpc/Mp for steel I-shaped sections. Eq. H1-1 is the AISC design interaction formula, shown as a piecewise linear curve. The 'Exact' curve is specifically for a W8x31 section. The approximate average curve for I-shapes is shown as a dashed line and exhibits higher capacity, notably reaching Mpc/Mp = 1.0 at a normalized axial force of approximately 0.15.))
Fig. C-H1.1. Stub-column interaction curves: plastic moment versus axial force for wide-flange shapes, major-axis flexure [W8×31 (W200×46.1), Fy = 50 ksi (345 MPa)].
The interaction equations are designed to be very versatile. The terms in the denominator fix the endpoints of the interaction curve. The nominal flexural strength, , is determined by the appropriate provisions from Chapter F. It encompasses the limit states of yielding, lateral-torsional buckling, flange local buckling, and web local buckling.
The axial term, , is governed by the provisions of Chapter E, and it can accommodate nonslender or slender element columns, as well as the limit states of major- and minor-axis buckling, and torsional and flexural-torsional buckling. Furthermore,
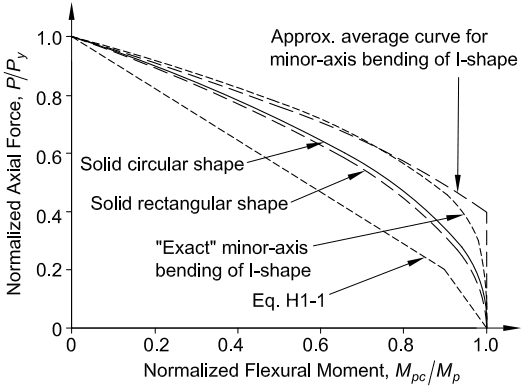
Figure description:
Interaction of Normalized Axial Force and Normalized Flexural Moment Comparison of different cross-sectional shapes and theoretical/empirical curves
Normalized Axial Force vs. Normalized Flexural Moment Interaction Curves
Legend
- Eq. H1-1 — color: black; symbol: Dashed line
- Solid rectangular shape — color: black; symbol: Solid line
- Solid circular shape — color: black; symbol: Dashed line
- "Exact" minor-axis bending of I-shape — color: black; symbol: Dashed line
- Approx. average curve for minor-axis bending of I-shape — color: black; symbol: Dashed line
| Normalized Flexural Moment, | Eq. H1-1 | Solid rectangular shape | Solid circular shape | "Exact" minor-axis bending of I-shape | Approx. average curve for minor-axis bending of I-shape |
|---|---|---|---|---|---|
| 0.0 | 1.00 | 1.00 | 1.00 | 1.00 | 1.00 |
| 0.1 | 0.91 | 0.97 | 0.98 | 0.98 | 0.98 |
| 0.2 | 0.82 | 0.90 | 0.93 | 0.95 | 0.96 |
| 0.4 | 0.64 | 0.78 | 0.83 | 0.86 | 0.88 |
| 0.6 | 0.46 | 0.63 | 0.68 | 0.74 | 0.77 |
| 0.8 | 0.29 | 0.45 | 0.50 | 0.58 | 0.62 |
| 0.9 | 0.20 | 0.32 | 0.38 | 0.46 | 0.54 |
| 0.95 | 0.10 | 0.22 | 0.28 | 0.38 | 0.48 |
| 1.0 | 0.00 | 0.00 | 0.00 | 0.00 | 0.41 |
| 1.0 | 0.00 | 0.00 | 0.00 | 0.00 | 0.00 |
Notes: The chart illustrates the relationship between normalized axial force (P/Py and normalized flexural moment (Mpc/Mp for various cross-sectional shapes and theoretical models. The 'Approx. average curve' shows a distinct vertical segment at a normalized moment of 1.0, indicating it can sustain up to approximately 40% of its axial yield capacity while reaching its full plastic moment capacity in minor-axis bending.))
Fig. C-H1.2. Stub-column interaction curves: plastic moment versus axial force for solid round and rectangular sections and for wide-flange shapes, minor-axis flexure.
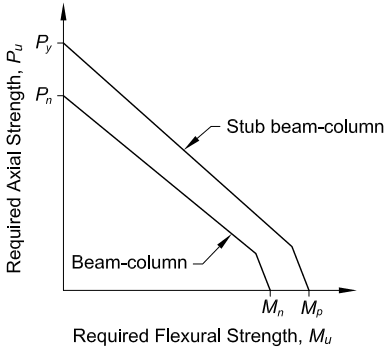
Figure description:
Structural Interaction Diagram
Required Axial Strength ( vs. Required Flexural Strength (
Legend
- Stub beam-column — color: black; symbol: Outer solid line
- Beam-column — color: black; symbol: Inner solid line
Annotations
- Stub beam-column (text_label - position: Points to the outer bilinear curve)
- Beam-column (text_label - position: Points to the inner bilinear curve)
| Required Flexural Strength, | Required Axial Strength, (Stub beam-column) | Required Axial Strength, (Beam-column) |
|---|---|---|
| 0 | ||
| null | 0 | |
| 0 | null |
Notes: The chart illustrates structural interaction diagrams. and represent different axial strength capacities, while and represent different flexural strength capacities. The 'kink' points represent the transition in the interaction equations (likely at based on AISC specifications.)
Fig. C-H1.3. Interaction curve for stub beam-column and beam-column.
is calculated for the applicable effective length of the column to take care of frame stability effects, if the procedures of Appendix 7, Section 7.2, are used to determine the required moments and axial forces. These required moments and axial forces must include the amplification due to second-order effects.
The utility of the interaction equations is further enhanced by the fact that they also permit the consideration of biaxial bending without the presence of axial load.
H1.2 Doubly and Singly Symmetric Members Subjected to Flexure and Tension
Section H1.1 considers the most frequently occurring cases in design: members under flexure and axial compression. Section H1.2 addresses the less frequent cases of flexure and axial tension. Because axial tension increases the bending stiffness of the member to some extent, Section H1.2 permits the increase of in Chapter F. Thus, when the bending term is controlled by lateral-torsional buckling, the moment gradient factor, , is increased by
For the 2010 AISC Specification (AISC, 2010), this multiplier was altered slightly as shown here to use the same constant, , as is used throughout the Specification when results at the ultimate strength level are required.
H1.3 Doubly Symmetric Rolled Compact Members Subjected to Single-Axis Flexure and Compression
For doubly symmetric wide-flange sections with moment applied about the -axis, the bilinear interaction Equation C-H1-5 is conservative for cases where the axial limit state is out-of-plane buckling and the flexural limit state is lateral-torsional buckling (Ziemian, 2010). Because this condition is common in building structures, the provisions of this section may be quite useful to the designer and lead to a more economical structure than solutions using Section H1.1. Section H1.3 gives an optional equation for checking the out-of-plane resistance of such beam-columns.
The two curves labeled Equation H1-1 (out-of-plane) and Equation H1-3 (out-of-plane) in Figure C-H1.4 illustrate the difference between the bilinear and the parabolic interaction equations for out-of-plane resistance for the case of a W27×84 (W690×125) beam-column, and , subjected to a linearly varying major-axis moment with zero moment at one end and maximum moment at the other end . In addition, the figure shows the in-plane bilinear strength interaction for this member obtained from Equation H1-1. Note that the resistance term, , may be larger than in LRFD or in ASD. The smaller ordinate from the out-of-plane and in-plane resistance curves is the controlling strength.
Equation H1-3 is developed from the following fundamental form for the out-of-plane lateral-torsional buckling strength of doubly symmetric I-section members. For LRFD,
(C-H1-6)
Specification for Structural Steel Buildings, August 1, 2022 AMERICAN INSTITUTE OF STEEL CONSTRUCTION
Equation H1-3 is obtained by substituting a lower bound of 2.0 for the ratio of the elastic torsional buckling resistance to the out-of-plane nominal flexural buckling resistance, , for W-shape members with . The 2005 AISC Specification (AISC, 2005b) assumed an upper bound, , in Equation C-H1-6 in the development of Equation H1-3 which led to some cases where the out-ofplane strength was overestimated. In addition, the fact that the nominal out-of-plane flexural resistance term, , may be larger than was not apparent in the 2005 AISC Specification. The changes that were implemented for the 2010 AISC Specification (AISC, 2010) continue to be applicable for this Specification.
The relationship between Equations H1-1 and H1-3 is further illustrated in Figures C-H1.5 (for LRFD) and C-H1.6 (for ASD). The curves relate the required axial force, (ordinate), and the required bending moment, (abscissa), when the interaction Equations H1-1 and H1-3 are equal to unity. The positive values of are compression and the negative values are tension. The curves are for a 10-ft- (3.1-m-) long member subjected to uniform major-axis bending, . The solid curve is for in-plane behavior, that is, lateral bracing prevents lateral-torsional buckling. The dotted curve represents Equation H1-1 for the case when there are no lateral braces between the ends of the beamcolumn. In the region of the tensile axial force, the curve is modified by the term
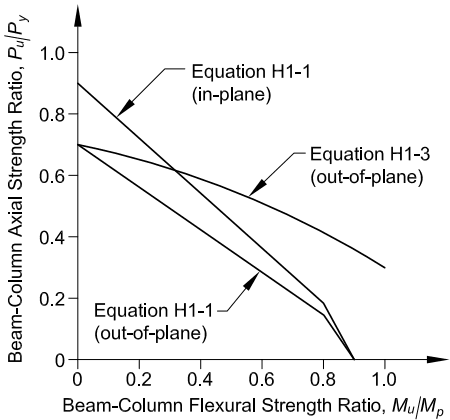
Figure description:
Beam-Column Strength Interaction Curves
Beam-Column Interaction Curves
Legend
- Equation H1-1 (in-plane — color: black; symbol: Solid line
- Equation H1-1 (out-of-plane — color: black; symbol: Solid line with kink
- Equation H1-3 (out-of-plane — color: black; symbol: Curved solid line
| Beam-Column Flexural Strength Ratio, | Equation H1-1 (in-plane) | Equation H1-1 (out-of-plane) | Equation H1-3 (out-of-plane) |
|---|---|---|---|
| 0.0 | 0.9 | 0.7 | 0.7 |
| 0.1 | 0.8 | 0.63 | null |
| 0.2 | 0.7 | 0.56 | 0.66 |
| 0.3 | 0.6 | 0.49 | null |
| 0.4 | 0.5 | 0.42 | 0.60 |
| 0.5 | 0.4 | 0.35 | null |
| 0.6 | 0.3 | 0.28 | 0.52 |
| 0.7 | 0.2 | 0.21 | null |
| 0.8 | 0.1 | 0.15 | 0.42 |
| 0.9 | 0.0 | 0.0 | null |
| 1.0 | null | null | 0.30 |
Notes: The graph shows the interaction between the beam-column axial strength ratio (Pu/Py and the flexural strength ratio (Mu/Mp based on equations H1-1 and H1-3. Equation H1-1 (in-plane is represented by a linear trend, while the out-of-plane versions of H1-1 and H1-3 show different non-linear or multi-segment behaviors.)))
Fig. C-H1.4. Comparison between bilinear (Equation H1-1), parabolic (Equation H1-3) out-of-plane strength interaction equations, and bilinear (Equation H1-1) in-plane strength interaction equation (W27×84, , ) (W690×125, ).
as permitted in Section H1.2. The dashed curve is Equation H1-3 for the case of axial compression, and it is taken as the lower bound determined using Equation C-H1-6 with taken equal to infinity for the case of axial tension. For a given compressive or tensile axial force, Equations H1-3 and C-H1-6 allow a larger bending moment over most of their applicable range.