C-E3E3 Flexural buckling of members without slender elements
PDF page 424 · AISC 360-22
Section E3 applies to compression members with all nonslender elements, as defined in Section B4.
The column strength equations in Section E3 are the same as those in the previous editions of the LRFD Specification, with the exception of the cosmetic replacement of the slenderness term, , by the more familiar slenderness ratio, , for 2005 and 2010, and by the simpler form of the slenderness ratio, , since 2016. For the convenience of those calculating the elastic buckling stress, , directly, without first calculating an effective length, the limits on the use of Equations E3-2 and E3-3 are also provided in terms of the ratio , as shown in the following discussion.
Comparisons between the previous column design curves and those introduced in the 2005 AISC Specification and continued in this Specification are shown in Figures C-E3.1 and C-E3.2 for the case of . The curves show the variation of the available column strength with the slenderness ratio for LRFD and ASD, respectively. The LRFD curves reflect the change of the resistance factor, , from 0.85 to 0.90 , as was explained in Commentary Section E1. These column equations provide improved economy in comparison with the editions of the Specification prior to 2005.
The limit between elastic and inelastic buckling is defined to be or . These are the same as that was used in the 2005 AISCSpecification. For convenience, these limits are defined in Table C-E3.1 for the common values of .
16.1-357
TABLE C-E3.1
Limiting values of Lc r and Fe
| Fy, ksi (MPa) | Limiting Lc/r | Fe, ksi (MPa) |
|---|---|---|
| 36 (250) | 134 | 16.0 (110) |
| 50 (345) | 113 | 22.2 (150) |
| 65 (450) | 99.5 | 28.9 (200) |
| 70 (485) | 95.9 | 31.1 (210) |
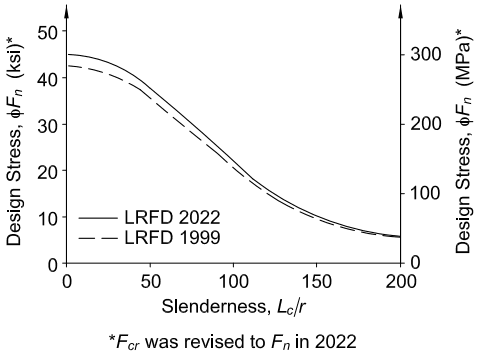
Figure description:
Design Stress Comparison: LRFD 2022 vs. LRFD 1999
Design Stress vs. Slenderness
Legend
- LRFD 2022 — color: black; symbol: Solid line
- LRFD 1999 — color: black; symbol: Dashed line
Annotations
- *F_{cr} was revised to F_n in 2022 (text_label - position: bottom)
| Slenderness () | LRFD 2022, (ksi) | LRFD 1999, (ksi) | LRFD 2022, (MPa) | LRFD 1999, (MPa) |
|---|---|---|---|---|
| 0 | 45.0 | 42.5 | 310.3 | 293.0 |
| 10 | 44.5 | 42.0 | 306.8 | 289.6 |
| 20 | 43.5 | 41.0 | 299.9 | 282.7 |
| 30 | 42.0 | 39.5 | 289.6 | 272.3 |
| 40 | 40.5 | 38.0 | 279.2 | 262.0 |
| 50 | 38.0 | 35.5 | 262.0 | 244.8 |
| 60 | 35.0 | 32.5 | 241.3 | 224.1 |
| 70 | 31.5 | 29.5 | 217.2 | 203.4 |
| 80 | 27.5 | 26.0 | 189.6 | 179.3 |
| 90 | 23.5 | 22.5 | 162.0 | 155.1 |
| 100 | 20.0 | 19.0 | 137.9 | 131.0 |
| 110 | 17.0 | 16.0 | 117.2 | 110.3 |
| 120 | 14.5 | 14.0 | 100.0 | 96.5 |
| 130 | 12.0 | 11.5 | 82.7 | 79.3 |
| 140 | 10.5 | 10.0 | 72.4 | 68.9 |
| 150 | 9.0 | 8.5 | 62.1 | 58.6 |
| 160 | 8.0 | 7.5 | 55.2 | 51.7 |
| 170 | 7.0 | 6.8 | 48.3 | 46.9 |
| 180 | 6.5 | 6.2 | 44.8 | 42.7 |
| 190 | 6.0 | 5.8 | 41.4 | 40.0 |
| 200 | 5.5 | 5.5 | 37.9 | 37.9 |
Notes: The chart includes two y-axes: the left in ksi and the right in MPa. The conversion factor used for the table is approximately 1 ksi = 6.89476 MPa.
Fig. C-E3.1. LRFD column curves compared.
Fig. C-E3.2. ASD column curves compared.
Specification for Structural Steel Buildings, August 1, 2022 AMERICAN INSTITUTE OF STEEL CONSTRUCTION
One of the key parameters in the column strength equations is the elastic critical stress, Fe. Equation E3-4 presents the familiar Euler form for Fe. However, Fe can also be determined by other means, including a direct frame buckling analysis or a torsional or flexural-torsional buckling analysis as addressed in Section E4.
The column strength equations of Section E3 can also be used for frame buckling and for torsional or flexural-torsional buckling (Section E4). They may also be entered with a modified slenderness ratio for single-angle members (Section E5).