C-F9F9 Tees and double angles loaded in the plane of symmetry
PDF page 451 · AISC 360-22
This section addresses both tees and double angles loaded in the plane of symmetry. Editions of the Specification prior to 2016 did not distinguish between tees and double angles and as a result, there were instances when double angles would appear to have less strength than two single angles. This Specification continues with the requirements implemented with the 2016 Specification (AISC, 2016) by providing separate provisions for tees and double angles. In those cases where double angles should have the same strength as two single angles, the provisions reference Section F10.
The lateral-torsional buckling strength of singly symmetric tee beams is given by a fairly complex formula (Ziemian, 2010). Equation F9-4 in the 2005 and 2010 AISCSpecifications (AISC, 2005b, 2010) is a simplified formulation based on Kitipornchai and Trahair (1980). See also Ellifritt et al. (1992).
TEES AND DOUBLE ANGLES LOADED IN THE PLANE OF SYMMETRY [Comm. F9.
For the limit state of lateral-torsional buckling when the stem of the member is in tension (that is, when the flange is in compression), Section F9.2 follows the gen- eral format for nominal flexural resistance (see Figure C-F1.2). The 2010 AISC Specification transitioned abruptly from the full plastic moment to the elastic buck- ling range. The plastic range then often extended for a considerable length of the beam. In the 2016 AISC Specification, a linear transition from full plastic moment, Mp, to the yield moment, My, as shown by the dashed line in Figure C-F9.1, was introduced to bring the members into conformance with the lateral-torsional buckling rules for I-shaped beams. This is continued in this Specification. It should be noted that the ratio of the plastic moment to the yield moment, M p M y, is in excess of 1.6, and is usually around 1.8 for tee and double-angle beams in flexure. The plastic moment value is limited to 1.6My to preclude potential early yielding under service loading conditions. For double-angle legs in compression, the plastic moment is lim- ited to 1.5My, while for tee stems in compression the plastic moment value is limited to My. There are no known studies that show what strength tee stems in compression can achieve. Thus, this conservative limit from previous editions of this Specification has been continued.
The WT6×7 (WT155×10.5) used for Figure C-F9.1 is an extreme case. For most
shapes, the length, , is impractically long. Also shown in Figure C-F9.1 are two additional points: the square symbol is the length when the center deflection of the member equals under its self-weight. The round symbol defines the length when the length-to-depth ratio equals 24 .
The factor used for I-shaped beams is unconservative for tee beams with the stem in compression. For such cases, is appropriate. When beams are bent in reverse curvature, the portion with the stem in compression may control the lateral-
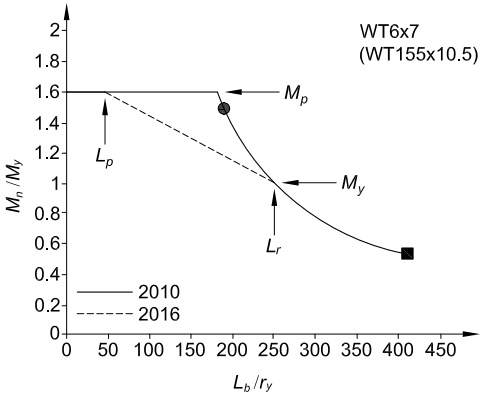
Figure description:
WT6x7 (WT155x10.5
WT6x7 (WT155x10.5
Legend
- 2010 — color: black; symbol: Solid line
- 2016 — color: black; symbol: Dashed line
Annotations
- Mp (horizontal_line - position: y = 1.6)
- Lp (vertical_line - position: x = 50)
- Lr (vertical_line - position: x = 250)
- My (text_label - position: y = 1.0 at x = 250)
- Grey circle point (text_label - position: x = 190, y = 1.5)
- Black square point (text_label - position: x = 410, y = 0.54)
| Lb/ry | 2010 (Mn/My) | 2016 (Mn/My) |
|---|---|---|
| 0 | 1.6 | 1.6 |
| 50 | 1.6 | 1.6 |
| 100 | 1.6 | 1.45 |
| 150 | 1.6 | 1.3 |
| 185 | 1.6 | 1.195 |
| 190 | 1.5 | 1.18 |
| 200 | 1.4 | 1.15 |
| 250 | 1.0 | 1.0 |
| 300 | 0.81 | 0.81 |
| 350 | 0.67 | 0.67 |
| 400 | 0.56 | 0.56 |
| 410 | 0.54 | 0.54 |
Notes: The chart plots the normalized nominal moment capacity (Mn/My against the lateral-torsional buckling parameter (Lb/ry for a WT6x7 steel section, showing the differences between the 2010 and 2016 design specifications.))
Fig. C-F9.1. Comparison of the 2016 and 2010 Specification lateral-torsional buckling formulas when the stem is in tension.
torsional buckling resistance even though the moments may be small relative to other portions of the unbraced length with Cb ≈ 1.0. This is because the lateral-torsional buckling strength of a tee with the stem in compression may be only about one-fourth of the strength for the stem in tension. Because the buckling strength is sensitive to the moment diagram, Cb has been conservatively taken as 1.0 in Section F9.2. In cases where the stem is in tension, connection details should be designed to minimize any end restraining moments that might cause the stem to be in compression.
The 2005 AISC Specification did not have provisions for the local buckling strength of the stems of tee sections and the legs of double-angle sections under a flexural compressive stress gradient. The Commentary to this section in the 2005 AISC Specification explained that the local buckling strength was accounted for in the equation for the lateral-torsional buckling limit state, Equation F9-4, when the unbraced length, , approached zero. While this was thought to be an acceptable approximation at the time, it led to confusion and to many questions by users of the Specification. For this reason, Section F9.4, “Local Buckling of Tee Stems in Flexural Compression,” was added to provide an explicit set of formulas for the 2010 AISC Specification.
The derivation of these formulas is provided here to explain the changes. The classical formula for the elastic buckling of a rectangular plate is (Ziemian, 2010),
(C-F9-1)
where
For the stem of tee sections, the width-to-thickness ratio is equal to . The two rectangular plates in Figure C-F9.2 are fixed at the top, free at the bottom, and loaded, respectively, with a uniform and a linearly varying compressive stress. The corresponding plate buckling coefficients, , are 1.33 and 1.61 (Figure 4.4, Ziemian, 2010). The graph in Figure C-F9.3 shows the general scheme used historically in developing the local buckling criteria in AISC Specifications. The ordinate is the critical stress divided by the yield stress, and the abscissa is a nondimensional width-to-thickness ratio,
(C-F9-2)
In the traditional scheme, it is assumed the critical stress is the yield stress, , as long as . Elastic buckling, governed by Equation C-F9-1, commences when and . Between these two points, the transition is assumed linear to account for initial deflections and residual stresses. While these assumptions are arbitrary empirical values, they have proven satisfactory. The curve in Figure C-F9.4 shows the graph of the formulas adopted for the stem of tee sections when these elements are subjected to flexural compression. The limiting width-to-thickness ratio up to which is (using and ),
TEES AND DOUBLE ANGLES LOADED IN THE PLANE OF SYMMETRY [Comm. F9.
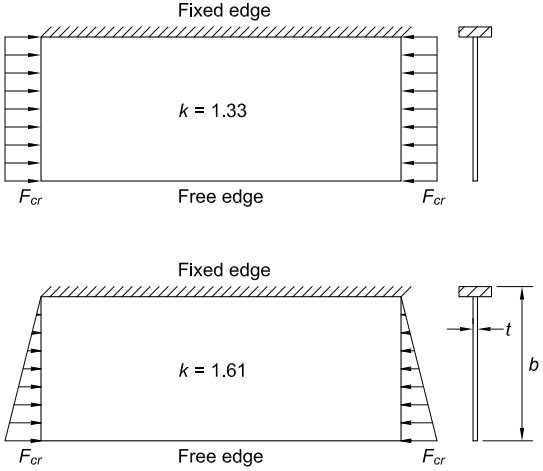
Figure description:
Plate Buckling Coefficients (k
-
Uniform Compression:
- Coefficient:
- Boundary Conditions: Fixed top edge, free bottom edge.
- Loading: Uniform compressive stress (.
-
Linearly Varying Compression:
- Coefficient:
- Boundary Conditions: Fixed top edge, free bottom edge.
- Loading: Linearly varying compressive stress (, maximum at the fixed edge.
Key Entities & Dimensions:
- : Plate depth/width.
- : Plate thickness.
- Structural Context: Applicable to the webs of Tees and double angles loaded in the plane of symmetry.
Fig. C-F9.2. Plate buckling coefficients for uniform compression and for linearly varying compressive stresses.
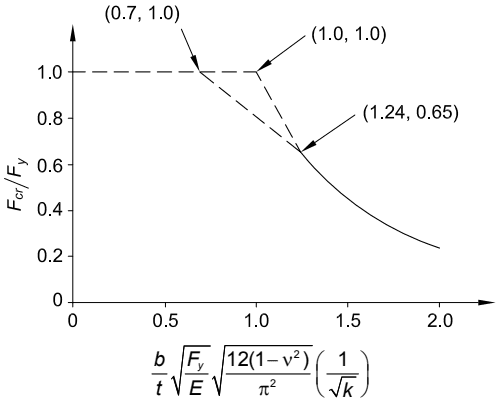
Figure description:
Fcr/Fy versus Slenderness Relationship
Normalized Critical Stress vs. Slenderness Parameter
Annotations
- (0.7, 1.0 (text_label - position: x = 0.7, y = 1.0))
- (1.0, 1.0 (text_label - position: x = 1.0, y = 1.0))
- (1.24, 0.65 (text_label - position: x = 1.24, y = 0.65))
| Slenderness parameter (x) | Line Style | |
|---|---|---|
| 0.0 | 1.0 | Dashed |
| 0.7 | 1.0 | Dashed |
| 1.0 | 1.0 | Dashed |
| 0.7 | 1.0 | Dashed |
| 1.24 | 0.65 | Dashed |
| 1.0 | 1.0 | Dashed |
| 1.24 | 0.65 | Dashed |
| 1.24 | 0.65 | Solid |
| 1.5 | 0.43 | Solid |
| 2.0 | 0.25 | Solid |
Notes: The x-axis represents a normalized slenderness parameter defined as (b/t * sqrt(F_y/E * sqrt(12(1-nu^2/pi^2 * (1/sqrt(k. The y-axis represents the ratio of critical stress to yield stress (F_cr/F_y. The plot includes several dashed line segments showing different theoretical thresholds and a solid curve for post-buckling behavior.)))))))
Fig. C-F9.3. General scheme for plate local buckling limit states.
λ=0.7= 12(1-v²) b d E 0.84 t√ E x²k t tw √ Fy
The elastic buckling range was assumed to be governed by the same equation as the local buckling of the flanges of a wide-flange beam bent about its minor axis, as given by Equation F6-4:
The underlying plate buckling coefficient for this equation is , which is a very conservative assumption for tee stems in flexural compression. An extensive direct analysis was performed by Richard Kaehler and Benjamin Schafer of the AISC Committee on Specifications Task Committee 4, on the elastic plate stability of a rolled WT-beam under bending causing compression at the tip of the stem, and it was found that the appropriate value for the plate-buckling coefficient is , resulting in Equation F9-19:
The transition point between the noncompact and slender range is
as listed in Table B4.1b, Case 14.
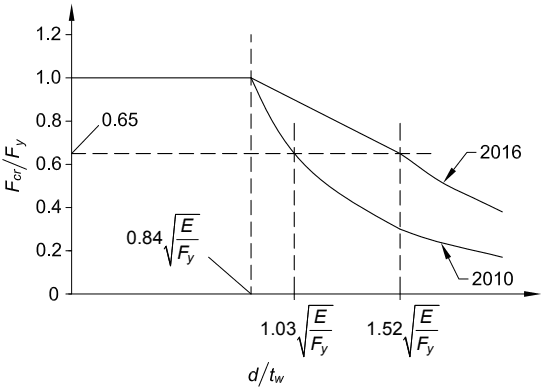
Figure description:
Comparison of 2010 and 2016 Critical Stress Standards
Normalized Critical Stress vs. Slenderness Ratio
Legend
- 2010 — color: black; symbol: Solid line
- 2016 — color: black; symbol: Solid line
Annotations
- 0.65 (horizontal_line - position: y = 0.65)
- 0.84 \sqrt{E/F_y} (vertical_line - position: x = 0.84 \sqrt{E/F_y})
- 1.03 \sqrt{E/F_y} (vertical_line - position: x = 1.03 \sqrt{E/F_y})
- 1.52 \sqrt{E/F_y} (vertical_line - position: x = 1.52 \sqrt{E/F_y})
| (2010) | (2016) | |
|---|---|---|
| 0 | 1.0 | 1.0 |
| 1.0 | 1.0 | |
| 0.65 | ||
| 0.65 |
Notes: The graph compares the critical stress ratio as a function of the slenderness ratio for the 2010 and 2016 standards. Both standards maintain a plateau at 1.0 until the onset of buckling at . After this point, the 2010 curve decreases more rapidly than the 2016 curve.
Fig. C-F9.4. Local buckling of tee stem in flexural compression.
The comparison between the web local buckling curves first introduced in the 2016 AISC Specification and continued in this edition, with the 2010 AISC Specification is illustrated in Figure C-F9.4.
Flexure about the y-axis of tees and double angles does not occur frequently and is not covered in this Specification. However, guidance is given here to address this condition. The yield limit state and the local buckling limit state of the flange can be checked by using Equations F6-1 through F6-3. Lateral-torsional buckling can conservatively be calculated by assuming the flange acts alone as a rectangular beam, using Equations F11-3 through F11-5. Alternately, an elastic critical moment given as
(C-F9-3)
may be used in Equations F10-2 or F10-3 to obtain the nominal flexural strength.