C-I3I3 Flexure
PDF page 500 · AISC 360-22
I3.1 General
Three types of composite flexural members are addressed in this section: fully encased steel beams, filled HSS, and steel beams with mechanical anchorage to a concrete slab which are generally referred to as composite beams.
I3.1a Effective Width
The same effective width rules apply to composite beams with a slab on either one side or both sides of the beam. In cases where the effective stiffness of a beam with a one-sided slab is important, special care should be exercised because this model can substantially overestimate stiffness (Brosnan and Uang, 1995). To simplify design, the effective width is based on the full span, center-to-center of supports, for both simple and continuous beams.
I3.1b Strength During Construction
Composite beam design requires care in considering the loading history. Loads applied to an unshored beam before the concrete has cured are resisted by the steel section alone; total loads applied before and after the concrete has cured are considered to be resisted by the composite section. It is usually assumed for design purposes that concrete has hardened when it attains 75% of its design strength. Unshored beam deflection caused by fresh concrete tends to increase slab thickness
and dead load. For longer spans this may lead to instability analogous to roof ponding. Excessive increase of slab thickness may be avoided by beam camber. Placing the slab to a constant thickness will also help eliminate the possibility of ponding instability (Ruddy, 1986). When forms are not attached to the top flange, lateral bracing of the steel beam during construction may not be continuous and the unbraced length may control flexural strength, as defined in Chapter F.
This Specification does not include special requirements for strength during construction. For these noncomposite beams, the provisions of Chapter F apply.
Load combinations for construction loads should be determined for individual projects considering the project-specific circumstances, using ASCE/SEI 37, Design Loads on Structures During Construction (ASCE, 2014) as a guide.
I3.2 Composite Beams with Steel Headed Stud or Steel Channel Anchors
This section applies to simple and continuous composite beams with steel anchors, constructed with or without temporary shores.
When a composite beam is controlled by deflection, the design should limit the behavior of the beam to the elastic range under serviceability load combinations. Alternatively, the amplification effects of inelastic behavior should be considered when deflection is checked.
Accurate prediction of flexural stiffness for composite beam members is difficult to achieve, and an examination of previous studies (Leon, 1990; Leon and Alsamsam, 1993) indicates a wide variation between predicted and experimental deflections. More recent studies indicate that the use of the equivalent moment of inertia, , for deflection calculations results in a prediction of short-term deflections roughly equivalent to the statistical average of the experimental tests reviewed (Zhao and Leon, 2013). Previous editions of the Specification recommended an additional reduction factor of 0.75 be applied to to form an effective moment of inertia; however, this approach has been removed as its basis could not be substantiated. An alternative approach is the lower-bound moment of inertia, , which is, as the name implies, a lower-bound approach that provides a conservative estimate of short-term deflections; values obtained by the approach correspond roughly to the mean plus one standard deviation ( ) based on the 120 tests examined (Zhao and Leon, 2013).
The lower-bound moment of inertia, , is defined as
(C-I3-1)
where
- distance from the compression force in the concrete to the top of the steel section, in. (mm)
- lower-bound moment of inertia, in.
- = moment of inertia for the structural steel section, in.
(C-I3-2)
The equivalent moment of inertia, , is defined as
(C-I3-3)
where
area of concrete slab within the effective width, in.
The effective section modulus, , referred to the tension flange of the steel section for a partially composite beam, may be approximated by
(C-I3-4)
where
- section modulus for the fully composite uncracked transformed section, referred to the tension flange of the steel section, in.
The value of may not be taken as greater than 1.0 in Equations C-I3-3 and C-I3-4. The upper bound of 1.0 represents a member that is fully composite.
Additionally, Equations C-I3-3 and C-I3-4 should not be used for ratios, , less than 0.25 . This restriction is to prevent excessive slip and the resulting substantial loss in beam stiffness. Studies indicate that Equations C-I3-3 and C-I3-4 adequately reflect the reduction in beam stiffness and strength, respectively, when fewer anchors are used than required for full composite action (Grant et al., 1977).
The use of a constant stiffness in elastic analyses of continuous beams is analogous to the practice in reinforced concrete design. The stiffness calculated using a weighted average of moments of inertia in the positive moment region and negative moment regions may take the following form:
(C-I3-5)
where
effective moment of inertia for positive moment, in.
effective moment of inertia for negative moment, in.
For continuous beams subjected to gravity loads only, the value of may be taken as 0.6 and the value of may be taken as 0.4 . For composite beams used as part of a lateral force-resisting system in moment frames, the value of and may be taken as 0.5 for calculations related to drift.
Practice in the United States does not generally require the following items to be considered. These items are highlighted here for designers evaluating atypical conditions for which they might apply.
- (a) Horizontal shear strength of the slab: For the case of girders with decks with narrow troughs or thin slabs, shear strength of the slab may govern the design (for example, see Figure C-I3.1). Although the configuration of decks built in the United States tends to preclude this mode of failure, it is important that it be checked if the force in the slab is large or an unconventional assembly is chosen. The shear strength of the slab may be calculated as the superposition of the shear strength of the concrete plus the contribution of any slab steel crossing the shear plane. The required shear strength, as shown in the figure, is given by the difference in the force between the regions inside and outside the potential failure surface. Where experience has shown that longitudinal cracking detrimental to serviceability is likely to occur, the slab should be reinforced in the direction transverse to the supporting steel section. It is recommended that the area of such reinforcement be at least 0.002 times the concrete area in the longitudinal direction of the beam and that it be uniformly distributed.
- (b) Rotational capacity of hinging zones: There is no required rotational capacity for hinging zones. Where plastic redistribution to collapse is allowed, the moments at a cross section may be as much as 30% lower than those given by a corresponding elastic analysis. This reduction in load effects is predicated, however, on the ability of the system to deform through very large rotations. To achieve these rotations, very strict local buckling and lateral-torsional buckling requirements must be fulfilled (Dekker et al., 1995). For cases in which a 10% redistribution is utilized, as permitted in Appendix 8, Section 8.2, the required rotation capacity is within the limits provided by the local and lateral-torsional buckling provisions of Chapter F. Therefore, a rotational capacity check is not normally required for designs using this provision.
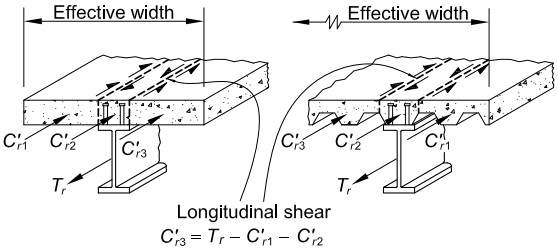
Figure description:
Subject: Longitudinal shear transfer in composite steel-concrete beam systems.
Key Components:
- Structural Elements: Steel I-beams supporting concrete slabs; includes both solid slabs (left and ribbed slabs on metal decking (right.
- Forces & Variables:
- : Longitudinal force in the steel beam.
- : Compressive force components within sections of the concrete slab.
- Effective Width: The lateral extent of the slab participating in composite action.
- Longitudinal Shear: Represented by shear flow arrows along vertical planes in the slab.
- Governing Equation: (defines the balance of longitudinal forces.
Fig. C-13.1. Longitudinal shear in the slab [Chien and Ritchie (1984)].
- (c) Long-term deformations due to shrinkage and creep: There is no direct guidance on the computation of the long-term deformations of composite beams due to creep and shrinkage. The long-term deformation due to shrinkage can be calcu- lated with the simplified model shown in Figure C-I3.2, in which the effect of shrinkage is taken as an equivalent set of end moments given by the shrinkage force (long-term restrained shrinkage strain times modulus of concrete times effective area of concrete) times the eccentricity between the center of the slab and the elastic neutral axis. If the restrained shrinkage coefficient for the aggre- gates is not known, the shrinkage strain, esh, for these calculations may be taken as 0.02%. The long-term deformations due to creep, which can be quantified using a model similar to that shown in the figure, are small unless the spans are long and the permanent live loads large. For shrinkage and creep effects, special attention should be given to lightweight aggregates, which tend to have higher creep coefficients and moisture absorption and lower modulus of elasticity than conventional aggregates, exacerbating any potential deflection problems. Engineering judgment is required, as calculations for long-term deformations require consideration of the many variables involved and because linear super- position of these effects is not strictly correct (ACI, 1997; Viest et al., 1997).
I3.2a Positive Flexural Strength
The flexural strength of a composite beam in the positive moment region may be controlled by the strength of the steel section, the concrete slab, or the steel headed stud anchors. In addition, web buckling may limit flexural strength if the web is slender and a sufficient portion of the web is in compression.
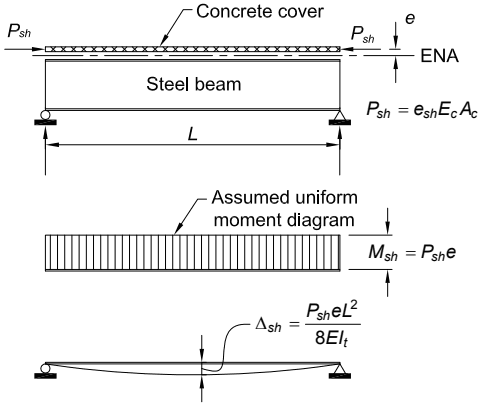
Figure description:
Diagram Components and Formulas
-
Entities:
- Concrete cover: Top layer of the composite section.
- Steel beam: Supporting structural element of span length .
- ENA: Effective Neutral Axis of the composite section.
- : Eccentricity between the center of the concrete cover and the ENA.
- : Shrinkage force acting on the concrete cover.
- : Bending moment resulting from shrinkage.
- : Deflection due to shrinkage.
-
Key Formulas:
- Shrinkage Force:
- Shrinkage Moment:
- Shrinkage Deflection:
-
Moment Profile: Assumed uniform moment diagram across the span .
Fig. C-I3.2. Calculation of shrinkage effects [from Chien and Ritchie (1984)].
Plastic Stress Distribution for Positive Moment. When flexural strength is deter- mined from the plastic stress distribution shown in Figure C-I3.3, the compression force in the concrete slab, C, is the smallest of the following:
| C = FyAs | (C-I3-6) |
| C = 0.85 f'cAc | (C-I3-7) |
| C = ΣQn | (C-I3-8) |
where
- area of concrete slab within effective width, in.
- area of steel cross section, in.
- = specified minimum yield stress of steel, ksi (MPa)
- specified compressive strength of concrete, ksi (MPa)
Longitudinal slab reinforcement makes a negligible contribution to the compression force, except when Equation C-I3-7 governs. In this case, the area of longitudinal reinforcement within the effective width of the concrete slab times the yield stress of the reinforcement may be added in determining C.
The depth of the compression block is
where
effective width of concrete slab, in. (mm)
A fully composite beam corresponds to the case where is governed by either Equation C-I3-6 or C-I3-7. If is governed by Equation C-I3-8, the beam is partially composite. The plastic stress distribution may have the plastic neutral axis (PNA) in the web, in the top flange of the steel section, or in the slab, depending on the governing .
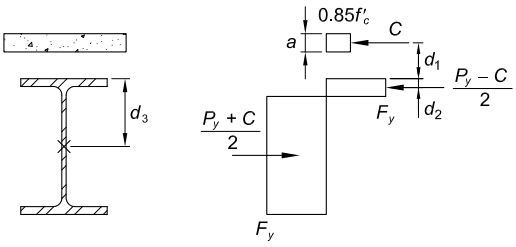
Figure description:
The image illustrates the plastic stress distribution for a composite beam under positive moment.
Key Entities and Information:
- Components: Concrete slab (top and steel I-beam (bottom.
- Forces:
- : Compressive force in the concrete slab, acting over depth with a stress of .
- : Compressive force in the top portion of the steel section (stress .
- : Tensile force in the bottom portion of the steel section (stress .
- Dimensions/Distances:
- : Depth of the concrete compression block.
- : Distance from the compression force to the center of the compression force in the steel.
- : Distance from the center of the steel compression force to the plastic neutral axis (PNA.
- : Distance from the top of the steel flange to the plastic neutral axis.
- Material Properties:
- : Specified compressive strength of concrete.
- : Specified minimum yield stress of steel.
- : Total yield strength of the steel section (.
Fig. C-13.3. Plastic stress distribution for positive moment in composite beams.
Using Figure C-I3.3, the nominal plastic moment strength of a composite beam in positive bending is given by
(C-I3-10)
where
tensile strength of the steel section, kips (N)
- distance from the centroid of the compression force in the steel section to the top of the steel section, in. (mm). For the case of no compression in the steel section, .
- distance from to the top of the steel section, in. (mm)
Equation C-I3-10 is applicable for steel sections symmetrical about one or two axes.
According to Table B4.1b, Case 15, local web buckling does not reduce the plastic strength of a bare steel beam if the width-to-thickness ratio of the web is not larger than . In the absence of web buckling research on composite beams, the same ratio is conservatively applied to composite beams. All current ASTM A6/A6M W-shapes have compact webs for .
Elastic Stress Distribution. For beams with more slender webs, this Specification conservatively adopts first yield as the flexural strength limit using the elastic stress distribution method. In this case, stresses on the steel section from permanent loads applied to unshored beams before the concrete has cured must be superimposed on stresses on the composite section from loads applied to the beams after hardening of concrete. For shored beams, all loads may be assumed to be resisted by the composite section.
When first yield is the flexural strength limit, the elastic transformed section is used to calculate stresses on the composite section. The modular ratio, , used to determine the transformed section, depends on the specified unit weight and strength of concrete.
I3.2b Negative Flexural Strength
Plastic Stress Distribution for Negative Moment. When an adequately braced compact steel section and adequately developed longitudinal reinforcing bars act compositely in the negative moment region, the nominal flexural strength is determined from the plastic stress distribution, as shown in Figure C-I3.4. Loads applied to a continuous composite beam with steel anchors throughout its length, after the slab is cracked in the negative moment region, are resisted in that region by the steel section and by properly anchored longitudinal slab reinforcement.
The tensile force, , in the reinforcing bars is the smaller of
| T = FyrAr | (C-I3-11) |
| T = ΣQn | (C-I3-12) |
where
- specified minimum yield stress of the slab reinforcement, ksi (MPa)
sum of the nominal strengths of steel headed stud anchors between the point of maximum negative moment and the point of zero moment to either side, kips (N)
A third theoretical limit on is the product of the area and yield stress of the steel section; however, this limit is redundant in view of practical limitations for slab reinforcement.
Using Figure C-I3.4, the nominal plastic moment strength of a composite beam in negative bending is given by
(C-I3-13)
where
- distance from to the top of the steel section, in. (mm)
When utilizing composite action in negative moment regions, designers need to recognize two interrelated factors (Figure C-I3.5). First, the plastic neutral axis will move up due to the presence of slab longitudinal reinforcement, resulting in an increase in longitudinal compressive strain in the bottom flange of the steel beam when compared to the case of flexure in the steel beam alone. This shift makes local buckling of the web and bottom flange more likely than if the girder were considered as a bare steel member and may also impact the global buckling of the member. Because local web buckling is likely the most critical mode, the User Note for this section advocates the use of Case 15 for the web and Case 10 for the flange in Table B4.1b.
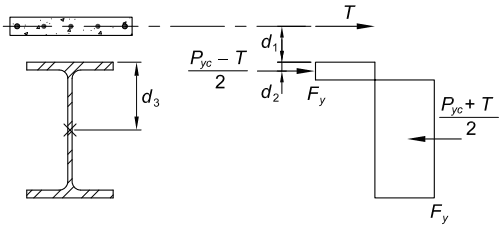
Figure description:
Image Type: Engineering Schematic (Plastic stress distribution for negative moment
Key Entities & Components:
- Concrete Slab: Contains longitudinal reinforcement bars providing tension force (.
- Steel I-Beam: Subjected to compressive stresses under negative moment.
- Plastic Neutral Axis (PNA: Positioned within the steel section, shifted upwards due to slab reinforcement.
- Stress Distribution:
- Tension (: Acting at the centroid of slab reinforcement.
- Compression (Top of Steel: Force equal to acting at distance from the top flange.
- Compression (Bottom of Steel: Force equal to acting in the lower portion of the beam.
- Yield Stress (: Maximum stress level for the steel sections.
Dimensions & Variables:
- : Distance from slab reinforcement centroid to the top of the steel beam.
- : Distance from the top of the steel beam to the centroid of the upper compression block.
- : Distance from the top of the steel beam to the bare steel plastic neutral axis.
- : Axial yield strength of the steel section in compression.
Fig. C-I3.4. Plastic stress distribution for negative moment.
Second, due to the presence of a slab, the global buckled shape as a function of the unbraced length of the member corresponds to a distortional buckling mode (Bradford and Trahair, 1981) rather than to a lateral-torsional buckling mode. As a result, the equations related to unbraced length given in Chapter F to determine the design strength of the steel beam, are not strictly applicable. However, analytical solutions for elastic distortional buckling indicate that, for most practical cases (for example, and , where length of span, distance between flange centroids, and thickness of web), the beam will be able to attain its plastic moment well before any global buckling occurs (Bradford and Gao, 1992). A simple and conservative solution for determining the limiting unbraced lengths of a composite beam in negative flexure is to replace the longitudinal reinforcement with an equivalent cover plate at the top flange and compute in accordance with Section F4. This approach is conservative, as it neglects the rotational stiffness provided by the slab.
I3.2c Composite Beams with Formed Steel Deck
Figure C-I3.6 is a graphic presentation of the terminology used in Section I3.2c.
The design rules for composite construction with formed steel deck are based upon a study (Grant et al., 1977) of the then-available test results. The limiting parameters listed in Section I3.2c were established to keep composite construction with formed steel deck within the available research data.
The Specification requires steel headed stud anchors to project a minimum of 1½ in. (38 mm) above the deck flutes. This is intended to be the minimum in-place projection, and stud lengths prior to installation should account for any shortening of the stud that could occur during the welding process. The minimum specified cover over a steel headed stud anchor of ½ in. (13 mm) after installation is intended to prevent the anchor from being exposed after construction is complete. In achieving this requirement, the designer should carefully consider tolerances on steel beam camber, concrete placement, and finishing tolerances, and the accuracy with which steel beam deflections can be calculated. In order to minimize the possibility of exposed anchors in the final construction, the designer should consider increasing the bare steel beam size to reduce or eliminate camber requirements (this also improves
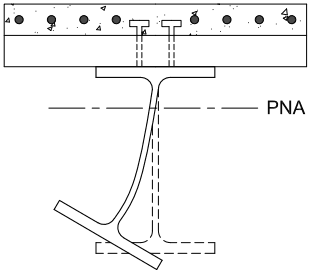
Figure description:
Key Information:
- Subject: Distortional buckling of a composite beam under negative moment.
- Structural Components:
- Concrete Slab: Top layer containing reinforcement bars and aggregate.
- Steel Headed Stud Anchors: Connect the steel beam to the concrete slab.
- Steel I-Beam: Shows lateral-torsional deformation of the bottom flange and web.
- Key Reference: PNA (Plastic Neutral Axis indicated by a dashed horizontal line.
- Mechanism: The top flange is restrained by the concrete slab, while the compression (bottom flange undergoes rotation and lateral displacement, leading to web distortion.
Fig. C-13.5. Distortional buckling for a composite beam under negative moment.
floor vibration performance), checking beam camber tolerances in the fabrication shop, and monitoring concrete placement operations in the field. Wherever possible, the designer should also consider providing for anchor cover requirements above the ½ in. (13 mm) minimum by increasing the slab thickness while maintaining the 1½ in. (38 mm) requirement for anchor projection above the top of the steel deck as required by the Specification.
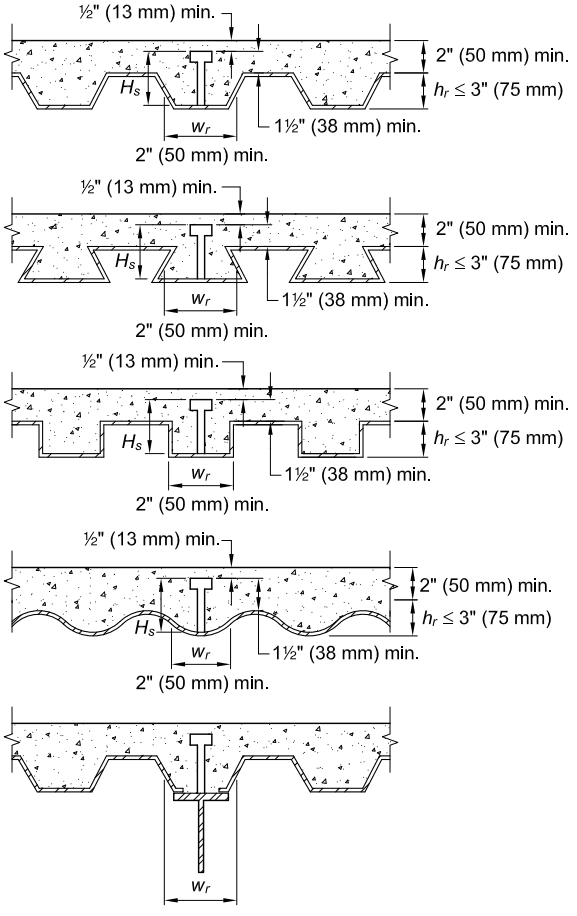
Figure description:
Key Information: Steel Deck Limits (Fig. C-I3.6
The technical diagrams illustrate dimensional requirements for composite steel deck and concrete slab construction:
- Concrete Slab Thickness: Minimum of 2 in. (50 mm above the top of the steel deck.
- Anchor Cover: Minimum of 1/2 in. (13 mm of concrete cover above the top of the shear anchor.
- Anchor Projection: Minimum of 1 1/2 in. (38 mm projection from the top of the steel deck to the top of the anchor (.
- Rib Height (: Maximum height of 3 in. (75 mm.
- Rib Width (: Minimum width of 2 in. (50 mm at the base.
- Deck Profiles: Includes various shapes such as trapezoidal, re-entrant (dovetail, rectangular, and sinusoidal/wavy patterns.
Fig. C-I3.6. Steel deck limits.
Specification for Structural Steel Buildings, August 1, 2022 AMERICAN INSTITUTE OF STEEL CONSTRUCTION
The maximum spacing of 18 in. (450 mm) for connecting composite decking to the support is intended to address a minimum uplift requirement during the construction phase prior to placing concrete (SDI, 2001).
I3.2d Load Transfer Between Steel Beam and Concrete Slab
I3.2d.1 Load Transfer for Positive Flexural Strength
Shear connection at the interface of a concrete slab and supporting steel members is an assembly consisting of the connector, typically a steel headed stud anchor, its weld to the steel member, and the surrounding concrete with a specific deck flute geometry. The shear connection deforms when subjected to shear at the interface. Its ability to deform without fracturing is known as slip capacity or ductility of the shear connection. It is important to note that the term ductility does not merely relate to the ductility of the connector itself, but to the ductility of the overall shear connection assembly. While the slip capacity of the shear connection consisting of a 3/4-in.- (19-mm-) diameter steel headed stud anchor embedded in a solid slab is about 1/4 in. (6 mm) (Oehlers and Coughlan, 1986), the shear connection with the same connector embedded in a slender concrete slab rib will possess only a fraction of this slip capacity (Lyons et al., 1994; Roddenberry et al., 2002a). Similarly, these same sources show that shear connection ductility can be significantly larger for some configurations.
Flexural strength of a composite section based on a plastic stress distribution is the most typical manner for establishing the member strength. It assumes sufficiently ductile steel and concrete components capable of developing a fully plastic stress block across the depth of the composite section. This analysis also assumes a sufficiently ductile shear connection, allowing for the shear at the interface to be evenly shared among the connectors located between the points of zero and maximum moment. Reliability studies evaluating the computational models for the flexural strength of composite beams (Galambos and Ravindra, 1978; Roddenberry et al., 2002a; Mujagic and Easterling, 2009) are based on the plastic stress distribution methodology. An implicit assumption of the theory is that the shear demands at the interface can be uniformly distributed over the shear span because the connectors are ductile and can redistribute the demands (Viest et al., 1997). Even when shear connections possess adequate ductility to accommodate interfacial slip, excessive slip demand at the interface may cause excessive discontinuities in the strain diagram at the interface of the concrete slab and cause early departure from the elastic behavior, and as a consequence, invalidate the design approach if inadequate connectivity is provided. It is therefore important to limit the shear connection slip demand at the interface.
The determination of flexural strength based on the plastic stress distribution method without any specific slip capacity checks was reasonable until the mid-1980s, given that low levels of partial composite action were uncommon in design and that most spans were relatively short. Today, the design for composite beams often involves much longer spans that are governed by serviceability criteria and therefore require less composite action to achieve their required strength. The simultaneous use of lower levels of composite action and longer spans results in additional deformation demands on the shear studs. Mujagic et al. (2015) and
Selden et al. (2015) indicate that long beams designed at low levels of partial composite action may not reach their nominal strength due to lack of connector deformation capacity.
The consideration of ductility demand at the interface of composite beams can come in the form of a number of different approaches of varying degrees of complexity. These approaches generally fall into two groups. First, the effect of shear at the interface can be taken into account directly in the determination of member strength through modeling of the interface slip. The complexity of such an analysis varies greatly based upon whether all components of the composite beams are idealized as linearly elastic (Newmark et al., 1951; Robinson and Naraine, 1988; Viest et al., 1997), or considered using a nonlinear analysis by capturing inelastic behavior of a partially yielded section and nonlinear behavior of the shear connection along the span (Salari et al., 1998; Salari and Spacone, 2001; Zona and Ranzi, 2014). Second, various indirect analytical models have been proposed. Such models aim to provide convenient computational models suitable for routine design use by either idealizing various components of the composite beam as fully elastic or fully plastic and capturing most dominant elements driving the shear connection ductility demand (Oehlers and Sved, 1995) or by parametrically relating the results of rigorous nonlinear finite element analyses to the most critical design properties affecting shear connection ductility through simple algebraic relationships (Johnson and Molenstra, 1991).
Configurations of composite beams as designed in routine practice depend on strength and serviceability requirements, detailing rules, construction sequence, framing details, fabrication logistics, fire rating requirements, as well as various other considerations related to standard practice. For beams that are loaded uniformly or due to equally spaced concentrated loads, such as a typical girder, the studies (Mujagic et al., 2015; Selden et al., 2015) indicate that beams are not susceptible to connector failure due to insufficient deformation capacity, and thus, need not be checked for this limit state if they meet one or more of the following conditions:
- (a) Beams with span not exceeding 30 ft (9.1 m);
- (b) Beams with a degree of composite action of at least 50%; or
- (c) Beams with an average nominal shear connector capacity of at least 16 kip/ft (230 000 N/m) along their shear span, corresponding to a 3/4-in.- (19-mm-) diameter steel headed stud anchor placed at 12 in. (300 mm) spacing on average.
Beams that do not meet the foregoing criteria or have an unsymmetrical loading configuration may still be acceptable and can be evaluated through direct nonlinear modeling of the member capturing all sources of deformation. Such modeling should be performed under factored loads using strength and stiffness properties of the member. The analysis should meet the pertinent requirements of Appendix 1. Furthermore, the analytical model should be validated using experimental data with respect to the load-deformation properties of both the member global behavior and the behavior of the shear connection at the interface of the slab and beam. Such validation should utilize strength and stiffness properties that match the
constitutive models reflected in the actual experimental data. Experimental data providing insight into the load-deformation response of the shear connection and the composite member as a whole is provided by Lyons et al. (1994) and Roddenberry et al. (2002a). As another alternative, the mixed analysis approach provided by Oehlers and Sved (1995) can be used.
When steel headed stud anchors are used on beams with formed steel deck, they may be welded directly through the deck or through prepunched or cut-in-place holes in the deck. The usual procedure is to install steel headed stud anchors by welding directly through the deck. However, special precautions and procedures recommended by the stud manufacturer should be followed when the following conditions exist:
- (a) The deck thickness is greater than 16 ga. (1.5 mm) for single thickness or 18 ga. (1.2 mm) for each sheet of double thickness; or
- (b) The total thickness of galvanized coating is greater than 1.25 ounces/ft² (0.38 kg/m²).
Composite beam tests in which the longitudinal spacing of steel headed stud anchors was varied according to the intensity of the static shear, and duplicate beams in which the anchors were uniformly spaced, exhibited approximately the same ultimate strength and approximately the same amount of deflection at nominal loads. Under distributed load conditions, only a slight deformation in the concrete near the more heavily stressed anchors is needed to redistribute the horizontal shear to other less heavily stressed anchors. The important consideration is that the total number of anchors be sufficient to develop the shear on either side of the point of maximum moment. The provisions of this Specification are based upon this concept of composite action.
I3.2d.2 Load Transfer for Negative Flexural Strength
In computing the available flexural strength at points of maximum negative bending, reinforcement parallel to the steel beam within the effective width of the slab may be included, provided such reinforcement is properly anchored beyond the region of negative moment. However, steel anchors are required to transfer the ultimate tensile force in the reinforcement from the slab to the steel beam.
When the steel deck includes units for carrying electrical wiring, crossover headers are commonly installed over the cellular deck perpendicular to the ribs. These create trenches that completely or partially replace sections of the concrete slab above the deck. These trenches, running parallel to or transverse to a composite beam, may reduce the effectiveness of the concrete flange. Without special provisions to replace the concrete displaced by the trench, the trench should be considered as a complete structural discontinuity in the concrete flange.
When trenches are parallel to the composite beam, the effective flange width should be determined from the known position of the trench.
Trenches oriented transverse to composite beams should, if possible, be located in areas of low bending moment and the full required number of studs should be placed between the trench and the point of maximum positive moment. Where the
trench cannot be located in an area of low moment, the beam should be designed as noncomposite.
I3.3 Encased Composite Members
Tests of concrete-encased beams demonstrate that (a) the encasement drastically reduces the possibility of lateral-torsional instability and prevents local buckling of the encased steel, (b) the restrictions imposed on the encasement practically prevent bond failure prior to first yielding of the steel section, and (c) direct bond interaction between the steel and concrete, without the use of additional anchorage, is insufficient to develop the composite action necessary to achieve the full plastic moment capacity of the composite section (Hawkins, 1973; ASCE, 1979; Juang and Hsu, 2006). Accordingly, this Specification permits three alternative design methods for the determination of the nominal flexural strength: (a) based on an elastic stress distribution using first yield in the tension flange of the composite section; (b) based on the plastic flexural strength of the steel section alone; and (c) based on the strength of the composite section obtained from the plastic stress distribution method or the strain-compatibility method. An assessment of the data indicates that the same resistance and safety factors may be used for all three approaches (Leon et al., 2007). For concrete-encased composite beams, method (c) is applicable only when shear anchors are provided along the steel section and reinforcement of the concrete encasement meets the specified detailing requirements. For concrete-encased composite beams, no limitations are placed on the slenderness of either the composite beam or the elements of the steel section, because the encasement effectively inhibits both local and lateral buckling.
In method (a), stresses on the steel section from permanent loads applied to unshored beams before the concrete has hardened must be superimposed on stresses on the composite section from loads applied to the beams after hardening of the concrete. In this superposition, all permanent loads should be multiplied by the dead load factor and all live loads should be multiplied by the live load factor. For shored beams, all loads may be assumed as resisted by the composite section. Complete interaction (no slip) between the concrete and steel is assumed.
Insufficient research is available to allow coverage of partially composite encased sections subjected to flexure.
Guidelines have been added for longitudinal and transverse steel limits and detailing based on past experience with concrete beams as covered in ACI 318 (ACI, 2019). Absent specific test results, the guidelines in ACI 318 are referenced. A requirement that concrete encased composite beams be tension controlled is provided so that a ductile performance occurs in case of an overload. The area of the steel core is intended to be included in checking this requirement.
I3.4 Filled Composite Members
Tests of filled composite beams indicate that (a) the steel HSS drastically reduces the possibility of lateral-torsional instability, (b) the concrete infill changes the local buckling mode of the steel HSS, and (c) direct bond interaction between the steel and concrete, without the use of additional anchorage, is sufficient to develop the composite action necessary to achieve the full plastic moment capacity even for cases with unrestrained slip potential (Lu and Kennedy, 1994; Prion and Boehme,
1994; Wheeler and Bridge, 2006; Leon et al., 2007; Lehman et al., 2018a; Kenarangi and Bruneau, 2019).
Figure C-I3.7 shows the variation of the nominal flexural strength, , of the filled section with respect to the HSS wall slenderness. As shown, compact composite sections can develop the full plastic strength, , in flexure. The nominal flexural strength, , of noncompact composite sections can be determined using a linear interpolation between the plastic strength, , and the elastic strength based on the yield strength, , with respect to the HSS wall slenderness. Slender-element composite sections are limited to developing the first yield moment, , of the composite section where the tension flange reaches first yielding, while the compression flange is limited to the critical buckling stress, , and the concrete is limited to linear elastic behavior with maximum compressive stress equal to (Lai et al., 2014). The nominal flexural strengths calculated using the Specification compare conservatively with experimental results (Lai et al., 2014; Lai and Varma, 2015). Figure C-I3.8 shows typical stress blocks for determining the nominal flexural strengths of compact composite, noncompact composite, and slender-element composite filled rectangular box sections.
Longitudinal and transverse reinforcement is not required for filled composite beams. Absent specific research and tests for internally reinforced filled composite beams, reasonable guidelines have been added for the case where internal longitudinal reinforcing steel is added. If internal reinforcement is provided for additional capacity, a minimum longitudinal reinforcing steel ratio of 0.004 is required as a reasonable lower limit based on past experience with concrete encased columns. Minimum transverse steel is required for holding the internal cage in place for constructability. Note that transverse reinforcement does not add significant shear strength to the member. The guidelines in ACI 318 are referenced for an upper-bound limit on longitudinal reinforcement. A requirement that filled composite beams be tension- controlled is therefore provided so that a ductile performance occurs in case of an overload. The area of the steel perimeter is intended to be included in checking this requirement.
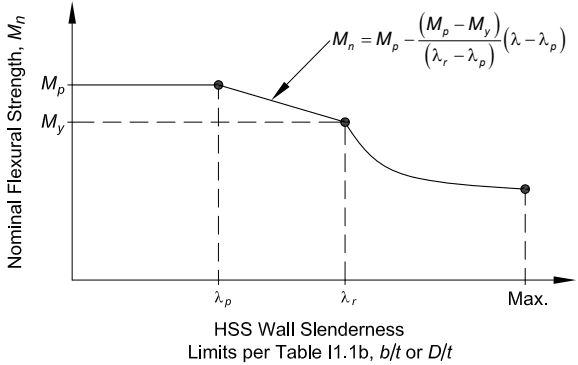
Figure description:
Nominal Flexural Strength vs. HSS Wall Slenderness Limits per Table I1.1b, b/t or D/t
Nominal Flexural Strength, M_n
Annotations
- M_n = M_p - ((M_p - M_y / (λ_r - λ_p * (λ - λ_p (text_label - position: Pointing to the linear line segment between λ_p and λ_r)))))
- M_y horizontal reference line (shaded_area - position: y = M_y, extending from the y-axis to x = λ_r)
- λ_p vertical reference line (vertical_line - position: x = λ_p)
- λ_r vertical reference line (vertical_line - position: x = λ_r)
- Max. vertical reference line (vertical_line - position: x = Max.)
| HSS Wall Slenderness (λ) | Nominal Flexural Strength (M_n) | Region Type |
|---|---|---|
| 0 | M_p | Start of constant strength region |
| λ_p | M_p | End of constant region / Start of linear transition |
| λ_r | M_y | End of linear transition / Start of non-linear decay |
| Max. | < M_y | End of defined range (non-linear curve) |
Notes: The chart illustrates the relationship between nominal flexural strength and HSS wall slenderness. It consists of three distinct regions: a plateau at plastic moment capacity (M_p until λ_p, a linear reduction to the yield moment (M_y at λ_r, and a subsequent non-linear curve representing slender behavior reaching until the maximum slenderness limit.))
Fig. C-13.7. Nominal flexural strength of a filled beam versus HSS wall slenderness.
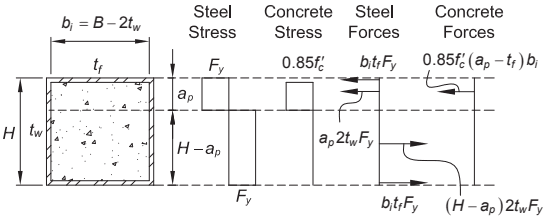
Figure description:
Plastic Neutral Axis and Distribution of Stresses and Forces
Stress and Force Distributions for a Concrete-Filled Steel Tube
Legend
- Steel Stress — color: null; symbol: Rectangular distribution
- Concrete Stress — color: null; symbol: Rectangular distribution
- Steel Forces — color: null; symbol: Vector arrows
- Concrete Forces — color: null; symbol: Vector arrows
Annotations
- (text_label - position: above the cross-section diagram)
- (text_label - position: vertical dimension of cross-section)
- (text_label - position: depth from top to neutral axis)
- (text_label - position: depth from neutral axis to bottom)
- (text_label - position: flange thickness)
- (text_label - position: web thickness)
| Category | Region / Depth | Stress | Resultant Force |
|---|---|---|---|
| Steel | Top Region (0 to ) | (at top flange, (in webs)) | |
| Steel | Bottom Region () to | (in webs, (at bottom flange))) | |
| Concrete | Top Region (0 to ) | ) | |
| Concrete | Bottom Region () to | 0 | 0 |
Notes: The figure illustrates the plastic stress distribution in a rectangular composite cross-section. The steel reaches yield stress in both tension and compression, while concrete reaches only in compression. represents the location of the plastic neutral axis.
Neutral axis location for force equilibrium:
(a) Compact composite section—stress blocks for calculating
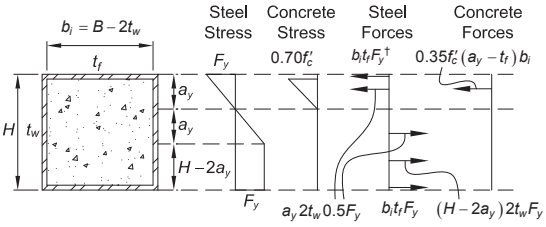
Figure description:
CFST Stress and Force Distributions
Internal Stress and Force Distributions for a CFST Section
Legend
- Steel Stress — color: black; symbol: diagram
- Concrete Stress — color: black; symbol: diagram
- Steel Forces — color: black; symbol: diagram with arrows
- Concrete Forces — color: black; symbol: diagram with arrows
Annotations
- Neutral axis location for steel and concrete is at depth a_y (text_label - position: y = a_y)
- Steel yields at depth 2a_y and remains constant below (text_label - position: y = 2a_y)
| Category | Parameter / Feature | Label / Expression |
|---|---|---|
| Section Dimensions | Internal width | |
| Section Dimensions | Flange width | |
| Section Dimensions | Web thickness | |
| Section Dimensions | Overall height | |
| Section Dimensions | Upper region height | |
| Section Dimensions | Middle region height | |
| Section Dimensions | Lower region height | |
| Steel Stress | Peak stress (Top/Bottom) | |
| Steel Stress | Stress at | |
| Steel Stress | Stress at | |
| Concrete Stress | Peak stress (Top) | |
| Concrete Stress | Stress at | |
| Steel Forces | Top flange force | |
| Steel Forces | Upper web force | |
| Steel Forces | Lower web force | ) |
| Steel Forces | Bottom flange force | |
| Concrete Forces | Upper core force | ) |
Notes: The figure describes the plastic stress and force distribution for a concrete-filled steel tube (CFST subjected to internal loading. Key dimensions include the outer height H and inner width b_i. The steel stress transitions from compression (Fy at the top to zero at depth a_y, then to tension (Fy at depth 2a_y, remaining constant thereafter. Concrete stress is modeled as a triangular block in compression reaching 0.70f'c at the top.)))
Neutral axis location for force equilibrium:
†Neglecting stress variation over flange thickness
(b) Noncompact composite section—stress blocks for calculating
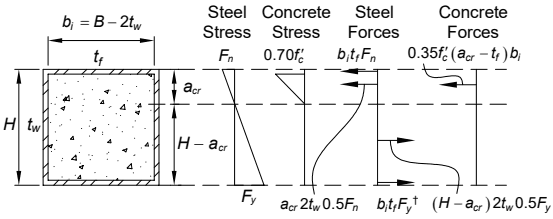
Figure description:
Steel-Concrete Composite Section Analysis Geometric and mechanical analysis of a composite rectangular section
Cross-sectional and Stress/Force Diagrams
Annotations
- Neutral Axis (horizontal_line - position: depth = a_cr)
| Category | Item / Location | Value / Formula |
|---|---|---|
| Dimensions | Internal width | |
| Dimensions | Flange thickness | |
| Dimensions | Web thickness | |
| Dimensions | Total column height | |
| Dimensions | Depth to neutral axis | |
| Dimensions | Depth below neutral axis | |
| Steel Stress | At top surface | (Compression) |
| Steel Stress | At bottom surface | (Tension) |
| Concrete Stress | At top surface | (Compression) |
| Concrete Stress | At neutral axis () | 0 |
| Steel Forces | Top flange resultant | |
| Steel Forces | Top web resultant | |
| Steel Forces | Bottom web resultant | ) |
| Steel Forces | Bottom flange resultant | |
| Concrete Forces | Concrete core resultant | ) |
Notes: The image provides a detailed analytical model for a rectangular composite steel-concrete section. It defines the internal geometric dimensions (b_i, t_f, t_w, H and the depth of the compression zone (a_cr. Four subsequent diagrams show the linear stress distributions for steel and concrete, followed by the discrete resultant force components for both materials. Forces directed to the left represent compression, while those directed to the right represent tension.))
Neutral axis location for force equilibrium:
†
Neglecting stress variation over flange thickness
(c) Slender-element composite section—stress blocks for calculating first yield moment,
Fig. C-13.8. Stress blocks for calculating nominal flexural strengths of filled rectangular box sections (Lai et al., 2014).
I3.5 Composite Plate Shear Walls
The flexural capacity of composite plate shear walls can be calculated using a plastic stress distribution over the wall cross section. This is in accordance with Section 11.2a, where the steel yield stress in compression and tension is equal to and the concrete compressive stress is equal to .